![]() Direct Drug Applications to Inner Ear Perilymph
Direct Drug Applications to Inner Ear Perilymph
Injecting drug solutions directly into the perilymphatic space has the potential to greatly increase the reliability of dosing compared to less-invasive methods, such as intratympanic application. When performed correctly, drug injected directly can be distributed throughout the ear in a reliable, quantitative manner. However, there are some serious pitfalls that have been demonstrated over the years that can result in totally ineffective drug applications. The pitfalls are often not obvious without careful measurements. The applied drug can be rapidly washed away both during and immediately following the application, as can occur when drug is injected through the round window membrane of rodents (Plontke et al., 2016). There are a number of publications where negative results with a treatment have likely resulted from a technically ineffective delivery method (e.g. Salt & Konishi, 1982; Sellick et al., 2007). Some technical problems occur when delivering drugs to rodents that are not encountered in humans and other primates, due to the large, open cochlear aqueduct in rodents.
FluidSim simulations are included for some examples to show predicted drug time courses and distribution characteristics for different injection rates and volumes. In most cases, they represent the situation for a large molecule that is not easily lost from perilymph (no elimination from ST or SV), delivered at a concentration of 100 (arbitrary units). The plots are given as a general guide and FluidSim can readily be configured to simulate the specific situation for any specific molecule with its elimination characteristics.
The figure below shows a diagram of the inner ear, labelled for reference, which will be used as the base for figures throughout this summary. For clarity, most of the labels are omitted in subsequent uses.

Schematic of the inner ear fluid compartments. Perilymph is show in pale yellow and endolymph is shown in dark blue. CSF is shown pale blue.
Brief Summary of the 3 Commonly-Used Injection Methods
(details of each are given further below)
Semi-circular canal injection, pipette sealed, no outlet

This is the most reliable way to load the entire perilymphatic space with drug. A limitation is that injecting enough drug to treat the basal regions of ST results in significant drug loss into the CSF.
Injection into the cochlear apex, pipette sealed, no outlet

This is the method of choice to deliver drug specifically to the hair cells and supporting cells of the organ of Corti and to the neural elements of the spiral ganglion.
Injection into the basal turn of scala tympani with no outlet

Injection through the round window membrane is appealing based on its technical simplicity, but is fraught with complexity in the outcome due to fluid leakage at the injection site. It is generally used with large molecules or gene therapy, which can be effective with small injection volumes.
Details of Each Injection Method
- Semi-circular canal injection, pipette sealed, no outlet
In rodents (mice and guinea pigs), this is an efficient method to deliver drug to the entire ear. The volume and rate injected depends on the species used, the drug’s kinetic properties and where in the ear is to be treated. Unfortunately, the basal turn of ST is the most difficult region to treat, as shown by the following simulations. In mice and rats, injection into the posterior semi-circular canal (PSCC) is used as it is superficial on the skull providing minimally-invasive access. Details of the method as used in mice is given in Ohlemiller at al., 2022.

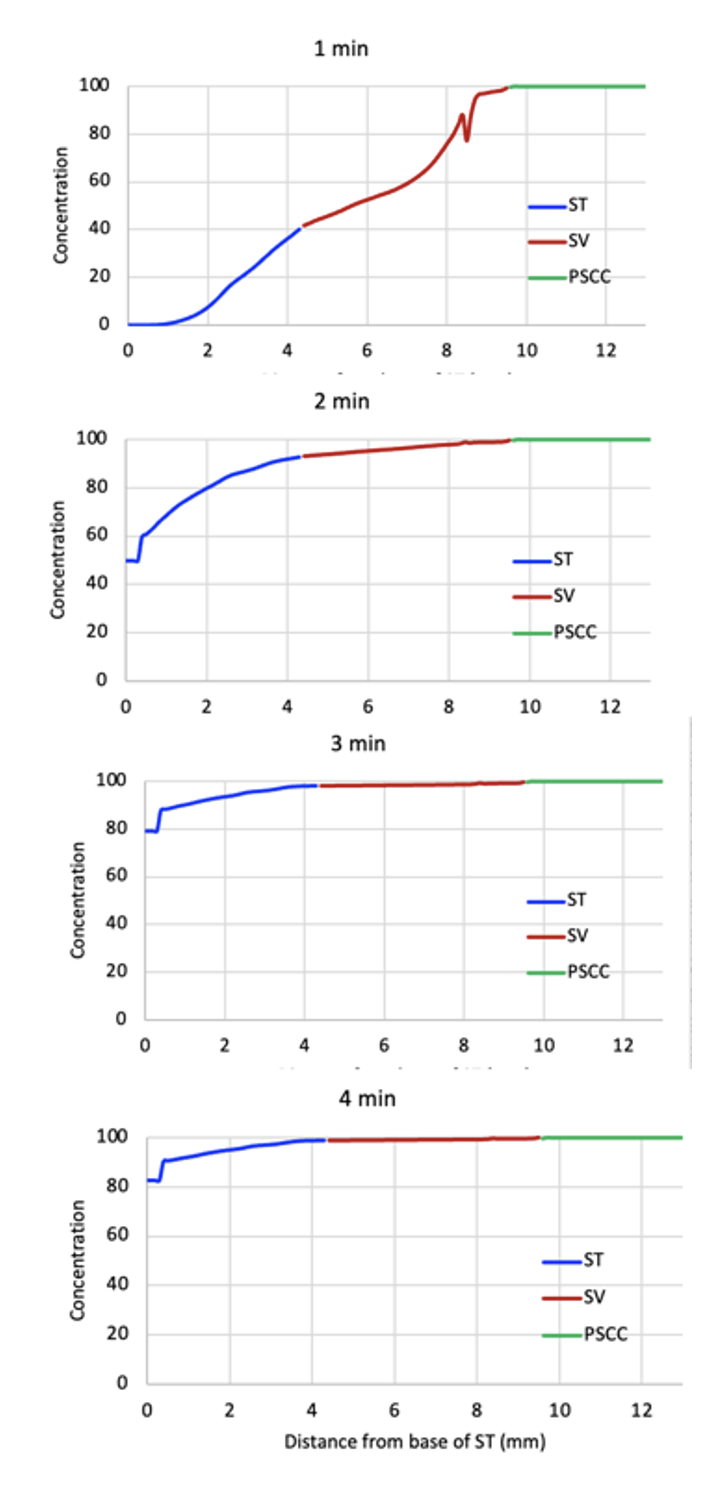
These plots for mice show the perilymph space “unrolled”, from the base of ST to the apex (blue), from the apex down SV (red) and along the semi-circular canal (green). It shows the result of an injection at 0.5 uL/min with drug that is not rapidly eliminated and is delivered at an arbitrary concentration of 100.
After 1 minute (top panel) the SCC and basal part of SV is filled but little has reached ST. After 2 min (middle panel), ST concentration is rising but has only reached 50% of the applied concentration at the base.
At 3 min (lower panel) the base of ST has reached 78% of the applied concentration.
At 4 min (the period typically used in our protocols, not shown), the base of ST reaches ~82% of the applied concentration
However, it is also sometimes necessary to consider how much drug is being driven into CSF by the injection. The plot (left) shows the total solute amount in the cochlea (all tissue and fluid spaces) and in CSF as a function of the injection duration.

A 4 min injection at 0.5 uL/min provides a near complete filling of the perilymph space with drug while minimizing the amount driven into CSF.
For guinea pigs, the situation is similar but perilymph volumes are larger in the guinea pig so the injected volume has to be larger. However, due to mechanical constraints, the injection rate cannot be increased too much, so the injection duration has to be longer. In our “standard” protocol we use a 30 min injection at 1 uL/min. As the lateral SCC is superficial and is easily exposed surgically in the guinea pig, this procedure can be performed reliably as a recovery procedure.

These figures show the perilymph spaces “unrolled” for the guinea pig during an injection at 1 uL/min.
It takes 10 min of injection for concentration to start rising in ST.
At 20 mins, the base of ST reaches 51% of the injected concentration. At this time just 9% of the injected drug has been driven into CSF.
At 30 min, the base of ST reaches 82% of the injected concentration with 29% of the injected drug being driven into CSF.
It is apparent that the entire perilymph space is reasonably well loaded by this protocol. However, this is the “best-case scenario” and assumes that none of the injected substance is eliminated (lost) to the vasculature.
In contrast, this simulation shows the “worst-case” scenario for a drug (triamcinolone-acetonide) that is quite rapidly eliminated from perilymph (SV half time 34 min, ST half time12 min).

As the drug solution moves along the fluid spaces the regions furthest from the injection site achieve lower concentrations.
At 20 min the base of ST reaches 30% of the applied concentration vs. 51% with no elimination (above).
At 30 min, the base of ST reaches 45% of the applied concentration, vs. 82% with no elimination.
Thus, the ability to load the perilymphatic spaces with drug depends to some extent on the drug’s properties.
For Humans, it will never be possible to load perilymph with drug by this method. In humans the cochlear aqueduct is smaller and less patent, so the injection rates would need to be lower to avoid pressurizing the ear during injection. In addition, perilymph volumes in the human are much larger. These two factors make it impossible to replace perilymph in the human by injection from a pipette sealed into the ear.
Injection into the cochlear apex, pipette sealed, no outlet
This method can be used in animals in which the apex can be readily accessed (rats, guinea pigs, mini-pigs, etc). It is more difficult to perform in mice and cannot be performed in the human, where the cochlear apex is embedded in thick bone.
It is performed as an acute, non-recovery procedure. Exposure of the cochlear apex is a major surgical procedure, so this cannot be performed as a recovery procedure.
It progressively fills ST with drug solution from apex to base, with the cochlear aqueduct providing the outlet for fluid flow.

These plots show the progression of drug down ST with an injection rate of 1 uL/min.
Even at 10 mins, the basal perilymph concentration only reaches 71% of the applied concentration. This is primarily due to exchange with adjacent tissue compartments, including the spiral ligament, organ of Corti and spiral ganglion.
By changing pump speed as a function of time to correct for scala area changes, it is possible to force the leading edge of the drug solution to travel down ST at a fixed rate.
This has become the basis for experiments to study the spatial origins of the cochlear potentials. Inhibitors such as kainite progressively knock out neural function from the apex to the base, allowing the spatial origins of neural potential (CAP and ABR) to be identified as detailed in Lichtenhan et al, 2016.
- Injection into the basal turn of scala tympani with no outlet
In this configuration the injection pipette is not sealed into the round window and fluid leaks around it before, during and after the injection procedure.
It is most effective when the injection pipette is inserted a short distance into ST, so the drug solution is injected as far (apically) as possible from the cochlear aqueduct and the resulting washout from flow between the aqueduct and the leaking injection site.
This procedure is typically only performed in species with larger ears, such as guinea pigs, mini-pigs and humans. It is not performed in mice due to the limited insertion distance of the injection pipette.
FluidSim set up to inject from a pipette inserted 1 mm form an insertion point of 0.8 mm from the base of ST (as indicated by the black lines). Note that drug rapidly spreads apical to the injection site by diffusion.


The figure (left) shows the distribution of drug along ST following RW injection of 5 uL solution (1 uL/min, 5 min), with an insertion depth of 1 mm from the insertion point of 0.8 mm.
The basal segment of ST is loaded which spreads apically by diffusion and is simultaneously washed out by CSF entering at the aqueduct and leaking from the injection site.
By 300 min, the drug is widely distributed along ST, albeit at approximately 30x lower concentration than that injected.
The time courses for 3 locations are shown at the right. The timing of Cmax varies with cochlear location.
This calculation shows that RW injection provides a good delivery system for large, impermeable molecules, antibodies, adenoviruses, etc provided the agent is therapeutic at the diluted concentration reaching apical regions.

However, the method is less suitable for small molecules that are eliminated from perilymph more rapidly. The graphs below show comparable calculations for a molecule with properties similar to dexamethasone (SV elimination 87 min, ST elimination 40 min).
Distribution to apical regions is extremely limited (1000x below that injected), as is the period of drug exposure (just a few hours)
In Humans, the relationship is similar. In this case the simulation is set for the injection pipette inserted 2 mm from the RW injection site at 1.5 mm. A 10 minute, 2 uL/min injection (20 uL total) is used, which is sufficient to load the basal region close to the applied concentration (100 arbitrary units). At 24 hours the drug has diffused throughout the cochlea, albeit at substantially lower concentration (about 50 - 100 x lower) than that injected.

The method works less-well for smaller molecules that are eliminated from perilymph.

The above plots show the calculated distribution (left) and time course (right) for RW injection of a molecule with elimination characteristics similar to dexamethasone. The amount of drug reaching apical regions is expected to be extremely low with an exposure duration of just a few hours.
Additional (lesser used) methods
- Injection into the basal turn of scala tympani with an outlet in a semi-circular canal.
 This method is appealing to distribute drug throughout the entire ear. Specifically in humans and other primates, where the cochlear aqueduct does not provide an outlet for flow of the volume necessary to fill the entire ear.
It has also been used in mice as a method to increase drug distribution throughout the ear but is only semi-quantitative.
Drug concentration in the perilymph spaces depends on both the injection rate (easily defined) and the rate of CSF flowing through the cochlea due to the perforation of the semi-circular canal (at an unknown rate – between 0 and 1 uL/min).
As the CSF entry rate may change as a result of pressure changes associated with drug injection, it is not simple to predict the drug concentrations and exposure.
Similar methodology has been considered for use in humans (to deal with the larger perilymph volume of the human cochlea) but fenestration of a semi-circular canal is generally considered as excessively invasive with concerns about how well the defect heals without resulting in a canal dehisence.
Intracochlear drug delivery devices
There is strong interest in the development of devices to deliver drugs to the ear more effectively using custom devices. This includes drug eluting cochlear implants, drug eluting implantable polymers and a variety of cannulas. Drug levels and distribution from such devices can be calculated using the FluidSim program, incorporating the specific properties of the device.
References
Lichtenhan JT, Hartsock J, Dornhoffer, JR, Donovan KM, Salt AN. Drug delivery into the cochlear apex: Improved control to sequentially affect finely spaced regions along the entire length of the cochlear spiral. Journal of Neuroscience Methods 2016, 273: 201-209.
Ohlemiller, KK, Hartsock, JJ, Salt, AN. Endocochlear Potential Measures, Local Drug Application and Perilymph Sampling in the Mouse Inner Ear. IN: Developmental, Physiological, and Functional Neurobiology of the Inner Ear. Editor Groves A. Springer press. 2022.
Plontke SK, Hartsock JJ, Gill RM, Salt AN Intracochlear drug injections through the round window membrane: Measures to improve drug retention. Audiol Neurootol. 2016, 21:72-79.
Sellick P, Layton MG, Rodger J, Robertson D. A method for introducing non-silencing siRNA into the guinea pig cochlea in vivo. J Neurosci Methods. 2008, 167:237-45.
Salt, A.N. and Konishi, T.: Functional importance of sodium and potassium in the guinea pig cochlea studied with amiloride and tetraethylammonium. Jap. J. Physiol. 1982, 32:219 230.
![]() has experts fully trained in all aspects of perilymph drug delivery and fluid sampling.
has experts fully trained in all aspects of perilymph drug delivery and fluid sampling.
If you need help, call (217) 602-0306 for assistance.

Background Solutions for Injections into the Inner Ear.
Alec Salt, June 25th, 2024
There is an increasing interest in the injection of drugs or other therapeutics directly into perilymph of the ear. Direct applications allow precise control of the drug concentration in perilymph compared to intratympanic (middle ear) delivery. With intratympanic applications the perilymph concentration is more variable as it depends on the ability of the drug to pass through the membranes of the round window and stapes. Distribution of drug along the cochlea may also be improved with direct applications.
When drug solution is administered intravenously the background medium is not of great significance physiologically as the drug in its background medium is only briefly in contact with biological tissues (specifically the tissues of the vein at the injection site and cells in the blood). The formulation is rapidly stirred, washed away and diluted by blood flow as it becomes evenly distributed throughout the vasculature.
Many other fluid systems of the body (urine in the collecting tubule, cerebrospinal fluid, aqueous humor of the eye) have “volume turnover” processes, in which new fluid is secreted or generated by specific tissues and taken up or lost to other structures (such as to the lymphatic system) resulting in turnover of the fluid. Cerebrospinal fluid is continually secreted in volume by the choroid plexus and is primarily cleared from the cranium by lymphatic vessels. Aqueous humor, the fluid in the anterior chamber of the eye, is generated by the ciliary body, located behind the iris, and drains through the trabecular meshwork, located in the angle between the iris and the cornea. The vitreous humor, the jelly-like contents in the globe of the eye behind the lens, is not secreted and resorbed in volume. Although the volume is “stagnant” the composition is actively maintained by local homeostatic mechanisms.
The perilymph of the ear is not gelatinous but is also “stagnant”, i.e. not stirred or mixed, with almost no volume turnover. Perilymph is influenced by limited interactions with CSF at the base of scala tympani through the cochlear aqueduct, providing some local dilution and CSF-perilymph exchange there. As with vitreous humor of the eye, there are local homeostatic mechanisms for different perilymph components, but each has individual different kinetic properties.
As there is no volume turnover of perilymph, how long the “full-strength” formulation injected stays in contact with the living tissues of the ear depends on how efficiently the solution was delivered. There are some very efficient methods of delivery into perilymph and there are other inefficient methods. Shown below are examples of the most efficient delivery method (injection from a pipette sealed into the semi-circular canal) compared with an inefficient delivery method (injection through the round window membrane).

Injection into a semi-circular canal (left side) drives the solution in both directions through the perilymphatic spaces of the canal, entering the vestibule, passing apically along scala vestibuli (SV) to the helicotrema at the cochlear apex, then basally down scala tympani (ST) to exit into the cranium through the cochlear aqueduct at the base of ST. This fills almost the entire perilymph space with concentrated, undiluted drug solution. Depending on the elimination characteristics of the drug there may be a gradient with highest concentration near the injection site and declining towards the exit at the base of ST. Nevertheless, many of the tissues of the ear are exposed to almost undiluted background medium of the injection which may influence the outcome.
With canal injections there may also a major difference between species. The mouse ear contains about 1 uL of perilymph, which can be replaced by injection at 1 µL/min for 4 mins (2 µL total). The guinea pig ear, in comparison, contains 15 µL of perilymph and requires a 30 min injection at 1 µL for replacement (30 µL total). The canal tissues of the mouse are therefore exposed to undiluted medium for 4 mins, while the guinea pig canal tissues are exposed for 30 min. Medium that causes no problems when injected into the mouse may cause problems when injected into the guinea pig or other larger species.
In contrast, injection through the round window membrane (right side) allows perilymph to leak out around the pipette (which is not sealed in place). The leaking perilymph is being replaced by CSF entering ST adjacent to the round window, a flow which dilutes both the drug level and background medium in ST. Drug distributes along ST by diffusion contributing to the concentration decline in the basal part of ST. When the pipette is removed, it leaves a hole in the round window membrane, allowing further washout with time. With this method the peak drug level at the base of ST may only be a small proportion of the injected concentration and will decline quickly with time. The background medium is similarly diluted, so the tissues are only exposed to diluted medium for a brief period. This method be suitable for large components in the formulation (antibodies, adenoviruses, etc) which are retained well in perilymph, but is typically not suitable for the delivery of small molecules. With this type of injection the composition of the background medium is of lesser importance.
The pH buffers commonly used for IV drug formulations include:
Phosphate Buffer (NaH2PO4/Na2HPO4): Effective in the physiological pH range, approximately from pH 6.0 to 8.0.
Citrate Buffer (Citric Acid/Sodium Citrate): More used with acidic drugs in the pH range from pH 3.0 to 6.0.
Acetate Buffer (Acetic Acid/Sodium Acetate): Suitable for acidic drugs, across the pH range of 3.5 to 5.6.
His Buffer (Imidazole/Histidine): Prevents aggregation of proteins; Used for formulations containing proteins tagged with histidine residues.
For cell culture, a variety of other buffers are widely used.
- HEPES (4-(2-hydroxyethyl)-1-piperazineethanesulfonic acid). pH range: 6.8 to 8.2
- Tris (tris(hydroxymethyl)aminomethane). pH range: 7.0 to 9.0
- MOPS (3-(N-morpholino)propanesulfonic acid) pH range: 6.5 to 7.9
Each provides good buffering capacity in the physiological pH range, relatively low toxicity to cells, and are compatible with many cell culture media. However, they may interfere with certain enzymatic reactions and in some cases affect cell growth.
For perilymphatic injections, a bicarbonate buffer is preferred, such as provided by MEM-alpha. This can be purchased sterile and without phenol red indicator dye.

The detailed composition of MEM-alpha is as follows:


Importantly, it contains physiological levels of most electrolytes, including Na, K, Ca, Mg Cl, HCO3.
MEM-alpha contains 26.2 mM sodium bicarbonate, so the pH dependence on CO2 level is close to that shown for the green curve (25 mM) in the following chart.

Out of the bottle, MEM-alpha has a pH above 8 but when injected into the ear this instantly becomes around 7.4 due to the near 5% prevailing CO2 content of perilymph inside the ear (gases diffuse and equilibrate very quickly).
If, for drug solubility or other issues (protein conformation, etc), injection of the alkaline formulation is undesirable then it can be pre-equilibrated and stored under a CO2 environment. For example, if an acid pH is desired for the formulation, then handling and storage under a 100% CO2 environment (pH around 6.5) may be appropriate. The injected formulation will immediately change to physiologic pH when injected into perilymph.
Injecting zero-bicarbonate solutions into the ear (such as PBS, HEPES- TRIS-buffered) should generally be avoided. The ear has massive amounts of carbonic anhydrase in the spiral ligament (necessary for endolymph bicarbonate regulation). When bicarbonate is low this catalyzes
CO2 + H2O <> H+ + HCO3-
generating bicarbonate and also acid (H+). The acid generation is so active that it swamps any pH buffering of the solution and perilymph becomes very acid. (This observation is based on perilymph pH measurements we made with microelectrodes in vivo during perfusion of buffer solutions in the 1990’s but never published).
Our experience is that the ear tolerates MEM-alpha injections very well. If another buffer system is to be used for formulation reasons, we will need to perform control injections (vehicle only) to determine how well the background solution is tolerated. This primarily applies to semi-circular canal injections, but may also be relevant to other forms of direct injection into perilymph.
We have experts fully trained in all aspects of perilymph drug delivery and sampling.
If you need help, call (217) 602-0306 for assistance.
Toxicity Assessments for Hearing and Balance
Before you start animal experiments measuring concentrations in the ear and their influence on hearing – use FluidSim Simulations.
Simulations provide a cost-effective way to design experiments with a minimum number of time points. They also help interpret blood and perilymph measurements, saving animals and reducing costs.
Turner Scientific’s FluidSim program is the most sophisticated inner ear simulator presently available.
As soon as you know the time course of the potentially toxic agent in blood, FluidSim can predict the time course for perilymph of the ear. The best time points for perilymph measurements can then be selected. FluidSim can be trained to replicate the amount of drug reaching the ear (by fitting to measured data), providing a complete time course and distribution of the agent within the ear.
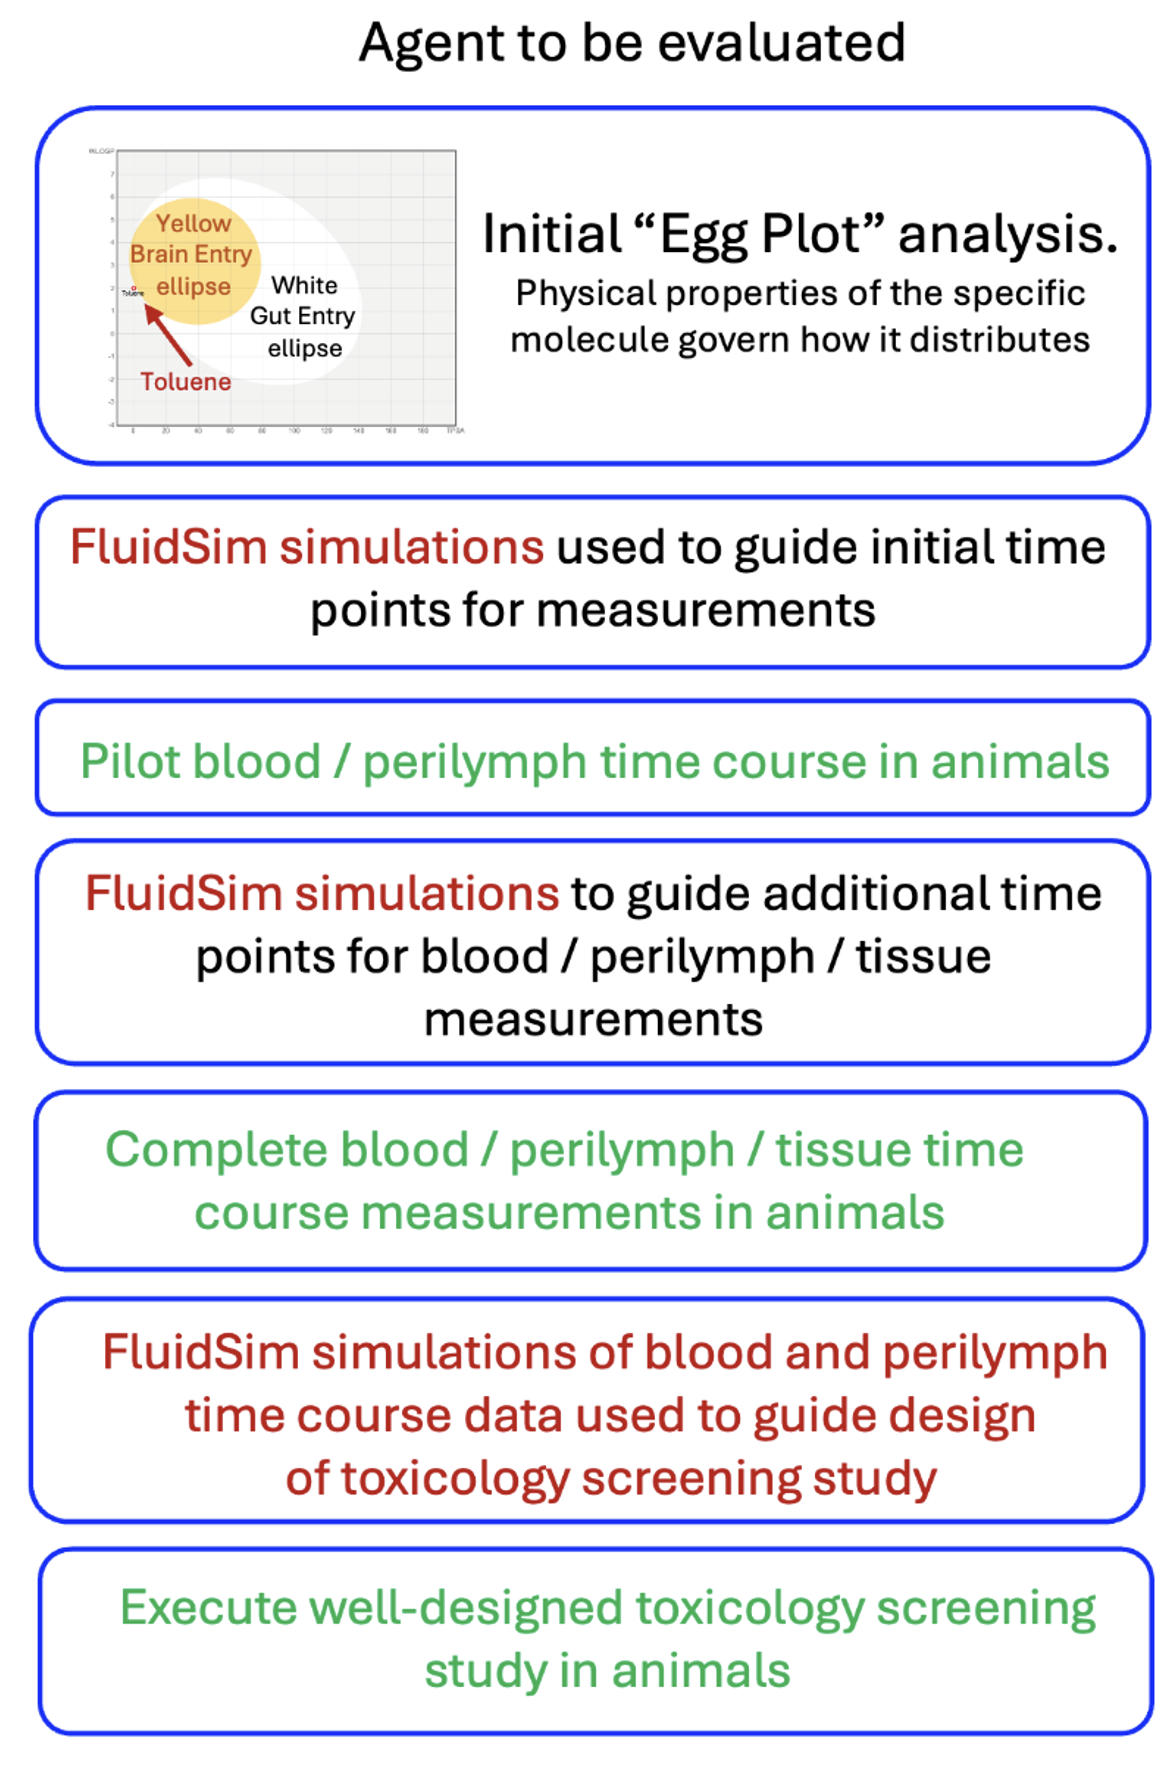
The inclusion of FluidSim analysis into the project allows toxicology experiments to be well-designed and efficient, minimizing the costs involved.
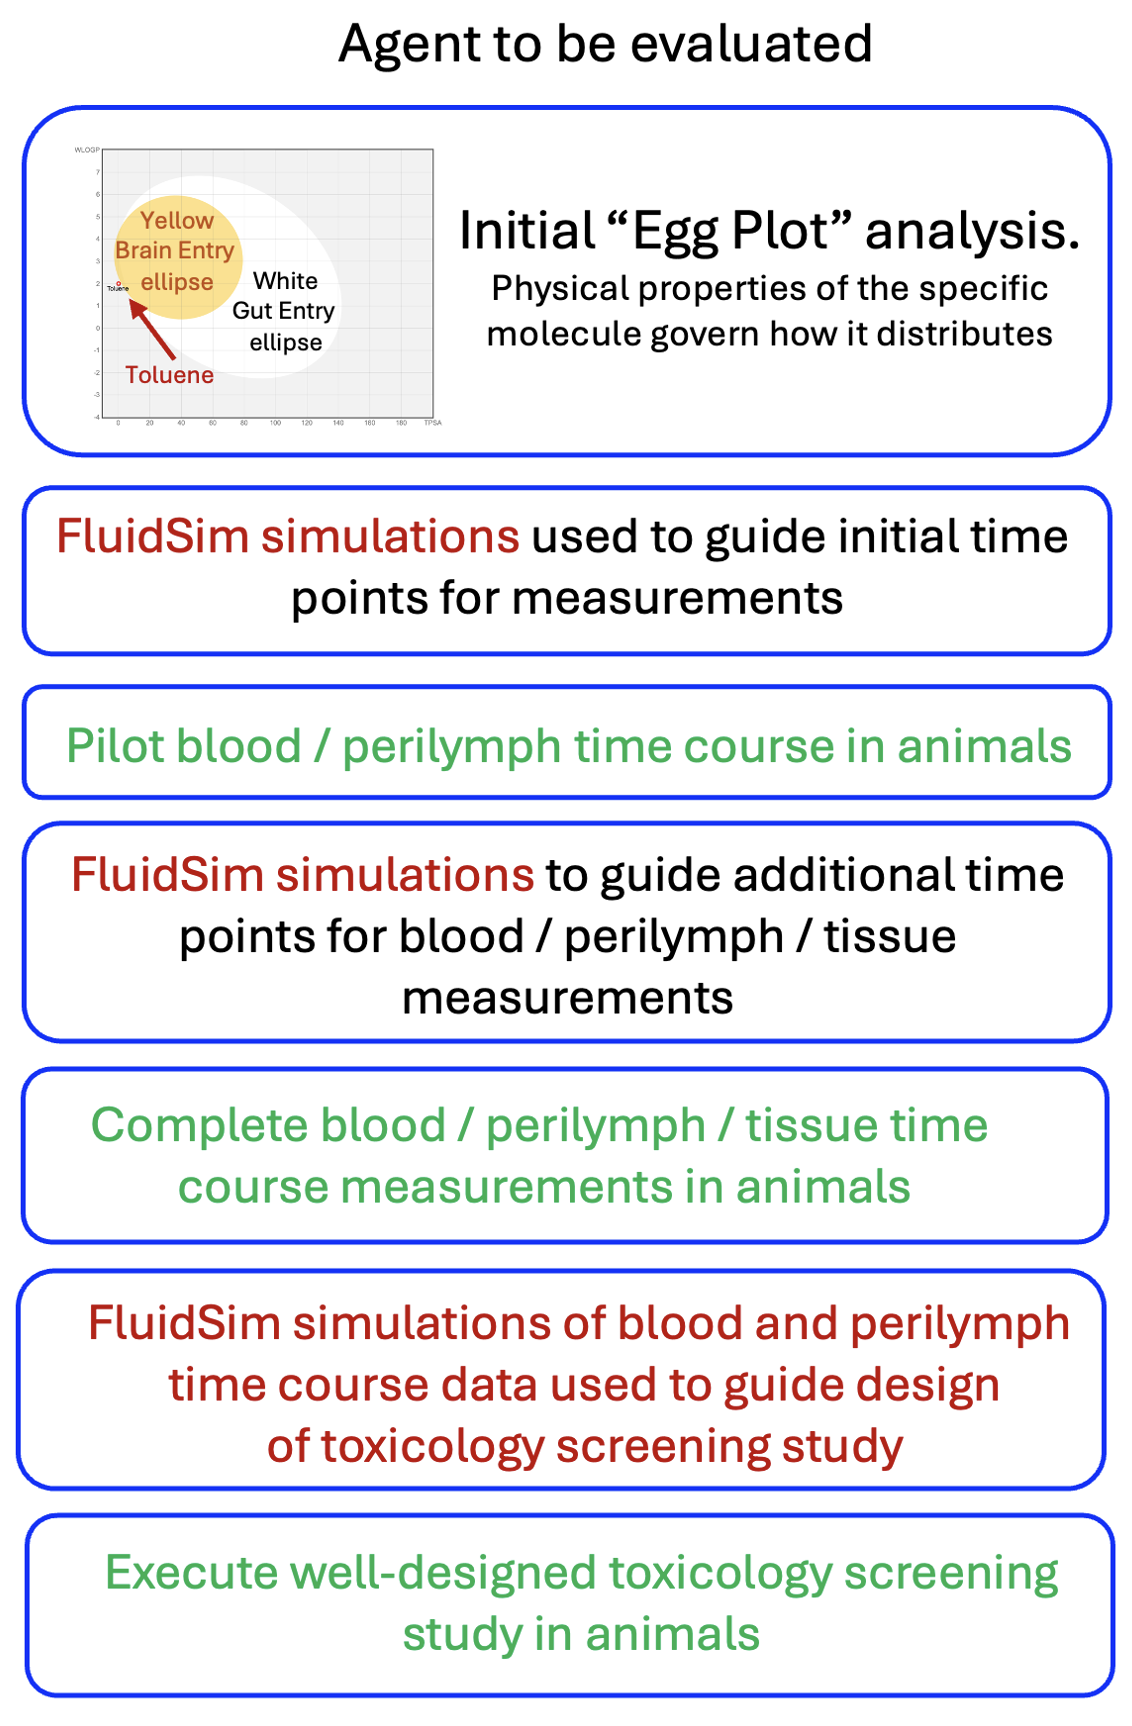
The flow chart above shows how FluidSim simulations can guide the toxicity evaluation process. FluidSim allows the experimental design at every step to be optimized, minimizing the animal numbers and costs involved.
FluidSim can be downloaded from the Turner Scientific website, allowing you to perform the calculations yourself.
OR
- The experienced staff at Turner Scientific can help guide you, providing FluidSim simulations and advice at each step of the process.
Contact Turner Scientific at This email address is being protected from spambots. You need JavaScript enabled to view it.
FluidSim Capabilities
What is FluidSim for and what does it do?
In contrast to blood, which is continually flowing and mixing, the fluids in the inner ear do not flow and are unstirred. So, when drug is applied, it doesn’t spread uniformly throughout the fluids. Instead, the drug slowly distributes along the fluid-filled spaces, a process that can take days. The rate of spread is so slow that if the drug leaks appreciably to the blood will never reach distant parts of the ear.
Therefore, for any drug being applied to the ear with a given methodology, we need to know how that drug distributes with distance and time. Distribution depends strongly on the physical properties of the drug. One of the primary tenets of pharmacotherapy is that the drug must reach the target tissue at a therapeutic concentration. In many cases this doesn’t happen for local drug therapies of the ear. Commonly the drug doesn’t reach the apical parts of the ear which are necessary to hear speech frequencies. For drug therapies of the cochlea, we therefore need to determine whether drug is reaching the targeted regions.
Situations where FluidSim can contribute:
1) We are giving a drug systemically that is potentially ototoxic at concentrations above 1 ng/mL. How do we design safety and toxicology studies at minimum cost?
Before you start animal experiments, use FluidSim Simulations to help identify potential safety concerns and toxicity for the ear. Analysis can use the agent’s chemical characteristics to predict whether the therapeutic reaches the inner ear and in what concentration. Simulations provide a cost-effective way to design experiments with a minimum number of time points. They also help interpret blood and perilymph measurements, focusing on times and locations when drug concentrations exceed toxic levels, thereby saving animals and reducing costs.
As data are collected, simulations are refined until the drug time courses in blood and perilymph are established. These data help guide the design of the toxicology screening study. A well-designed, efficient study helps minimize the costs involved.
2) Will my small molecule therapy that works well in mice will work equally well in humans?
No, not necessarily. The mouse cochlea is short (~ 5 mm) and the human is much longer (~30 mm). This means that drugs that distribute well and treat all frequency regions of the mouse cochlea do not necessarily distribute completely along the human cochlea, thereby leaving some regions untreated. Figure 3 shows dexamethasone (Dex) distribution along scala tympani of the mouse, guinea pig and human calculated by FluidSim for a sustained, 24 hour application.
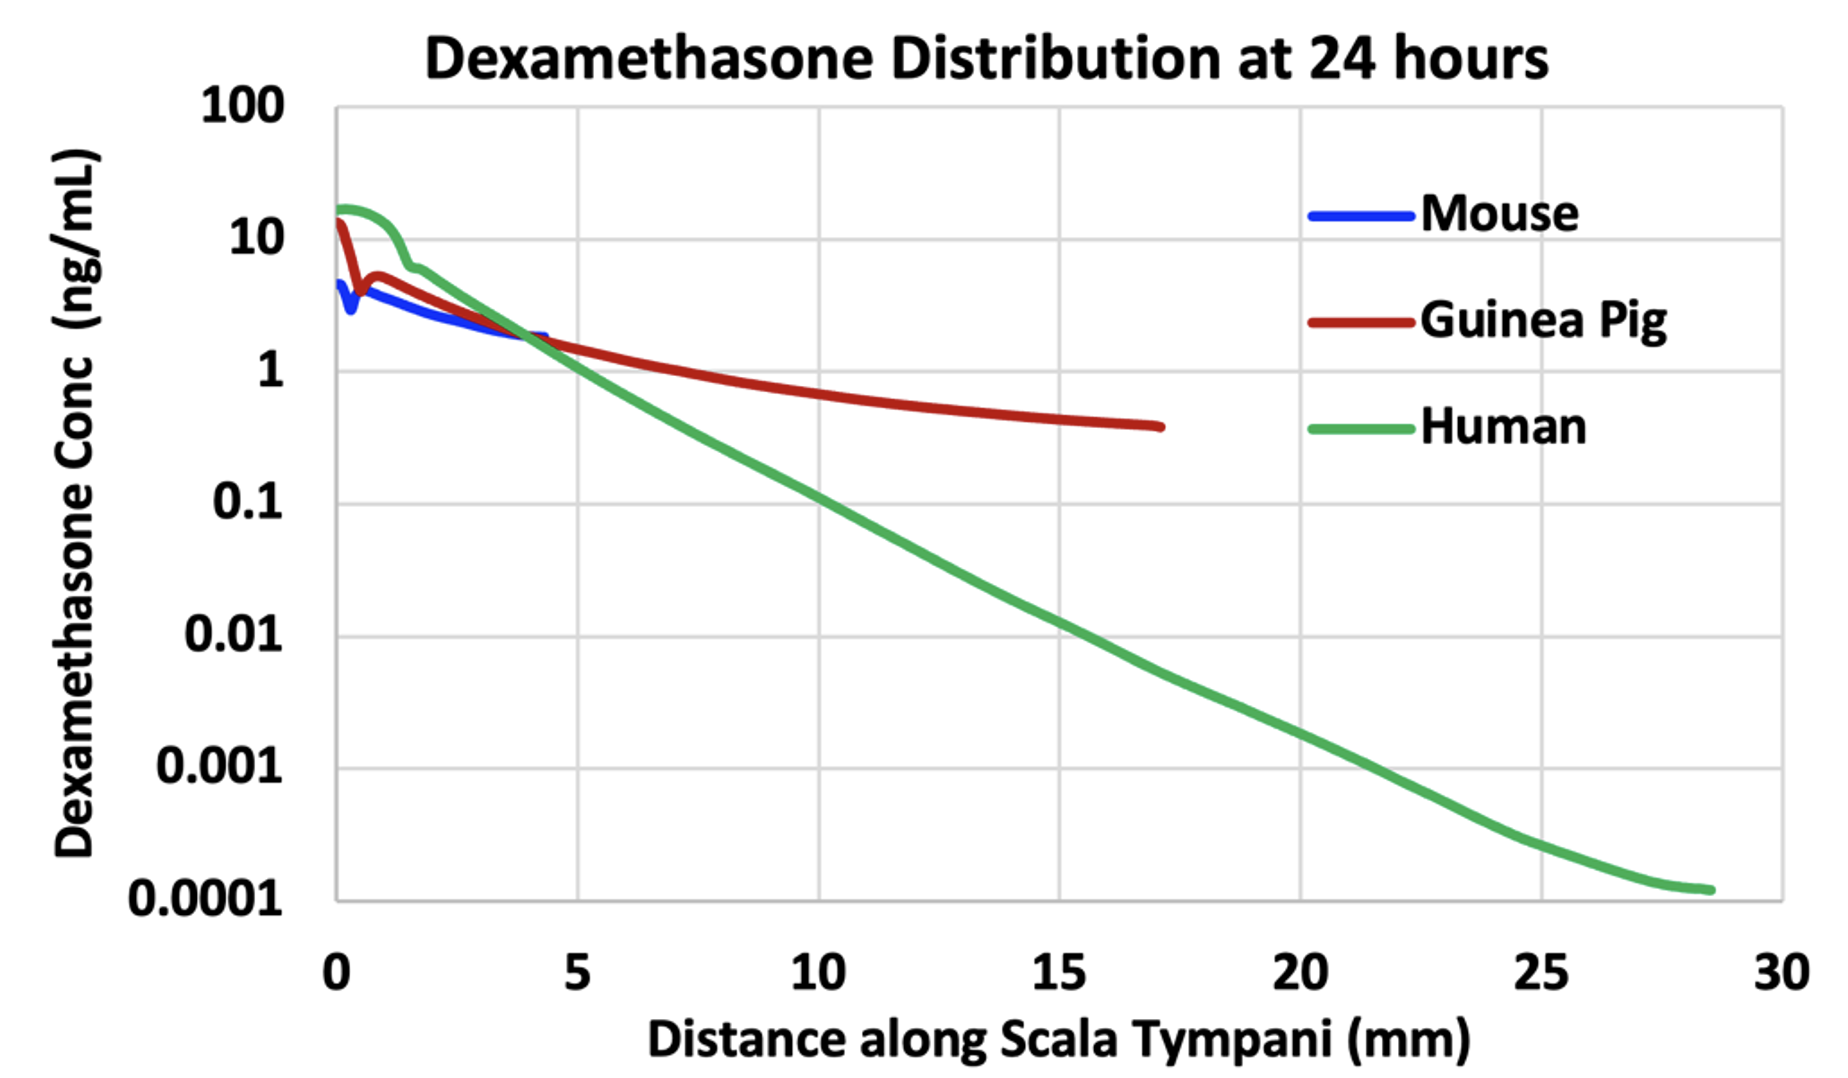
Figure 3: Dexamethasone gradients along ST calculated by FluidSim for a sustained application of dexamethasone (such as by dexamethasone suspension in gel) for 24 hours. The elimination half-times of dexamethasone were 40 min for ST and 87 min for SV. The “glitches” near the basal part of ST are the result of perilymph-CSF exchange through the cochlear aqueduct. In each case the “flattening” of the curve towards the apex is due to exchange with scala vestibuli across the helicotrema.
In the mouse, Dex is distributed along the entire length of the cochlea, with concentration at the apex just 2.5 x lower than at the base. In the guinea pig, the gradient is larger and is 35 x lower at the apex relative to the base. The gradient in the human is even larger, 136,000 x lower at the apex than the base, in part because a steady state has not been fully reached at 24 hours. Nevertheless, it is clear that apical regions of the human cochlea are treated with much lower levels of drug than basal regions.
It is also important to recognize that this is not an extreme example. How far drugs distribute along ST depends on how rapidly the substance is eliminated to blood. The half-time for Dex is estimated to be 40 min. The elimination rate of valproate, used in Frequency Therapeutics FX-322 formulation, was measured to be 19 min (McLean et al. 2021). The elimination rate of triamcinolone-acetonide was measured to be even faster, with a half time of 12 min (Salt et al. 2019). None of these drugs are suitable for treating the speech regions of the human cochlea. Figure 4 shows a figure from a corporate presentation by Frequency Therapeutics recognizing the limited spread of their therapeutic along the cochlea. The probably contributed to the failure of clinical trials with the therapy and the subsequent demise of the research program.
In conclusion, many drugs are not suitable for therapy of the speech regions of the human cochlea. Calculations with FluidSim can be instrumental in deciding whether a specific drug will distribute well, or not.
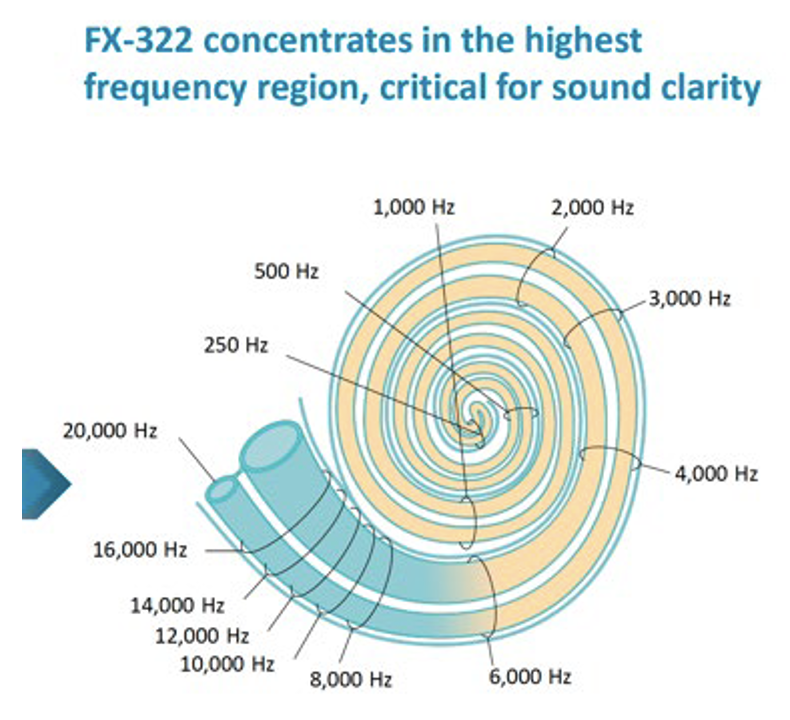
Figure 4: Calculated influence of Frequency Therapeutics FX-322 formulation along the human cochlea (figure taken from one of their public corporate presentations). It is notable that most of the speech frequency regions (all frequencies below 6 kHz) were NOT treated by their formulation, because of the limited distribution of drug along the cochlea.
3) Is my potential drug candidate suitable for local therapy of the human ear?
A lot of information is gained by calculating the physical properties of the drug, WLOGP (lipid partition coefficient) and TPSA (topological polar surface area). They can be calculated for any molecule on the SwissADME site (http://http://www.swissadme.ch). When WLOGP is plotted against TPSA it forms the so-called “egg plot”; Daina et al. 2017, providing a valuable indication of how the molecule will behave, as in Figure 5.
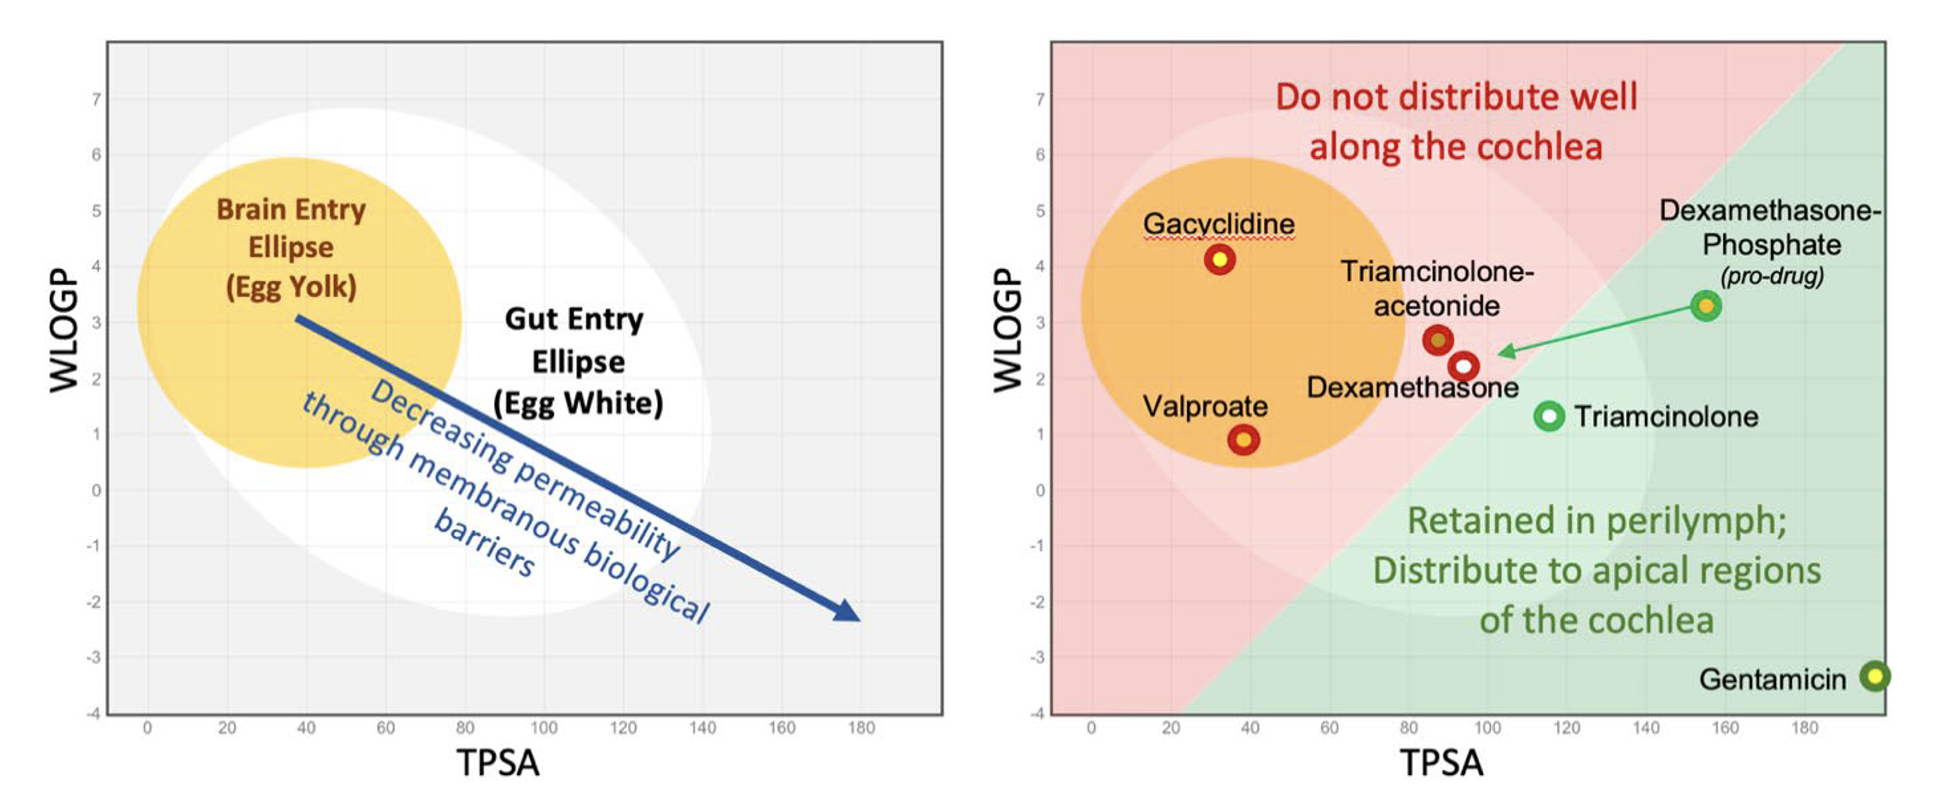
Figure 5: Left: As molecules become larger, more polar and less lipid-soluble (lower right of plot) they pass less easily through biological membranes. Molecules within the elliptical statistical boundaries pass through the blood brain barrier (yellow) or through the gut epithelium (white) respectively (Daina & Zoete, 2016; Daina et al. 2017). Right: Some example molecules relevant to the ear. Those in red are poorly suited to therapy of the cochlea, while those in green are retained in perilymph sufficiently to allow distribution towards apical cochlear regions. The red/green boundary is for illustrative purposes only and is not statistically based on data.
As shown in the right panel of Figure 5, molecules within or close to the “egg yolk” (in the red shaded area) commonly pass through biological membranes and are rapidly eliminated from perilymph. When applied intratympanically, they are generally NOT SUITABLE for treating speech regions of the cochlea.
A more detailed analysis of the molecule can be provided by analysis with FluidSim. If WLOGP and TPSA values for the molecule are entered on the “molecules” page FluidSim will then calculate the likely distribution of that molecule in the ear. FluidSim calculates rates of elimination from ST and SV are based on correlations established by measurement of elimination rates for 13 molecules in the Salt lab over the past 10 years (Figure 6). The fitted lines from these plots are used by FluidSim to predict the ST elimination rate, SV elimination rate and RWM permeability for each molecule, based on the “Egg Vector” derived from WLOGP and TPSA values. Middle ear elimination, by default is set to 49.6 min, which is the average of the 7 molecules for which middle ear elimination was measured (note that middle ear elimination can only be measured when drug is applied as a solution and cannot be measured when drug is applied as a suspension).
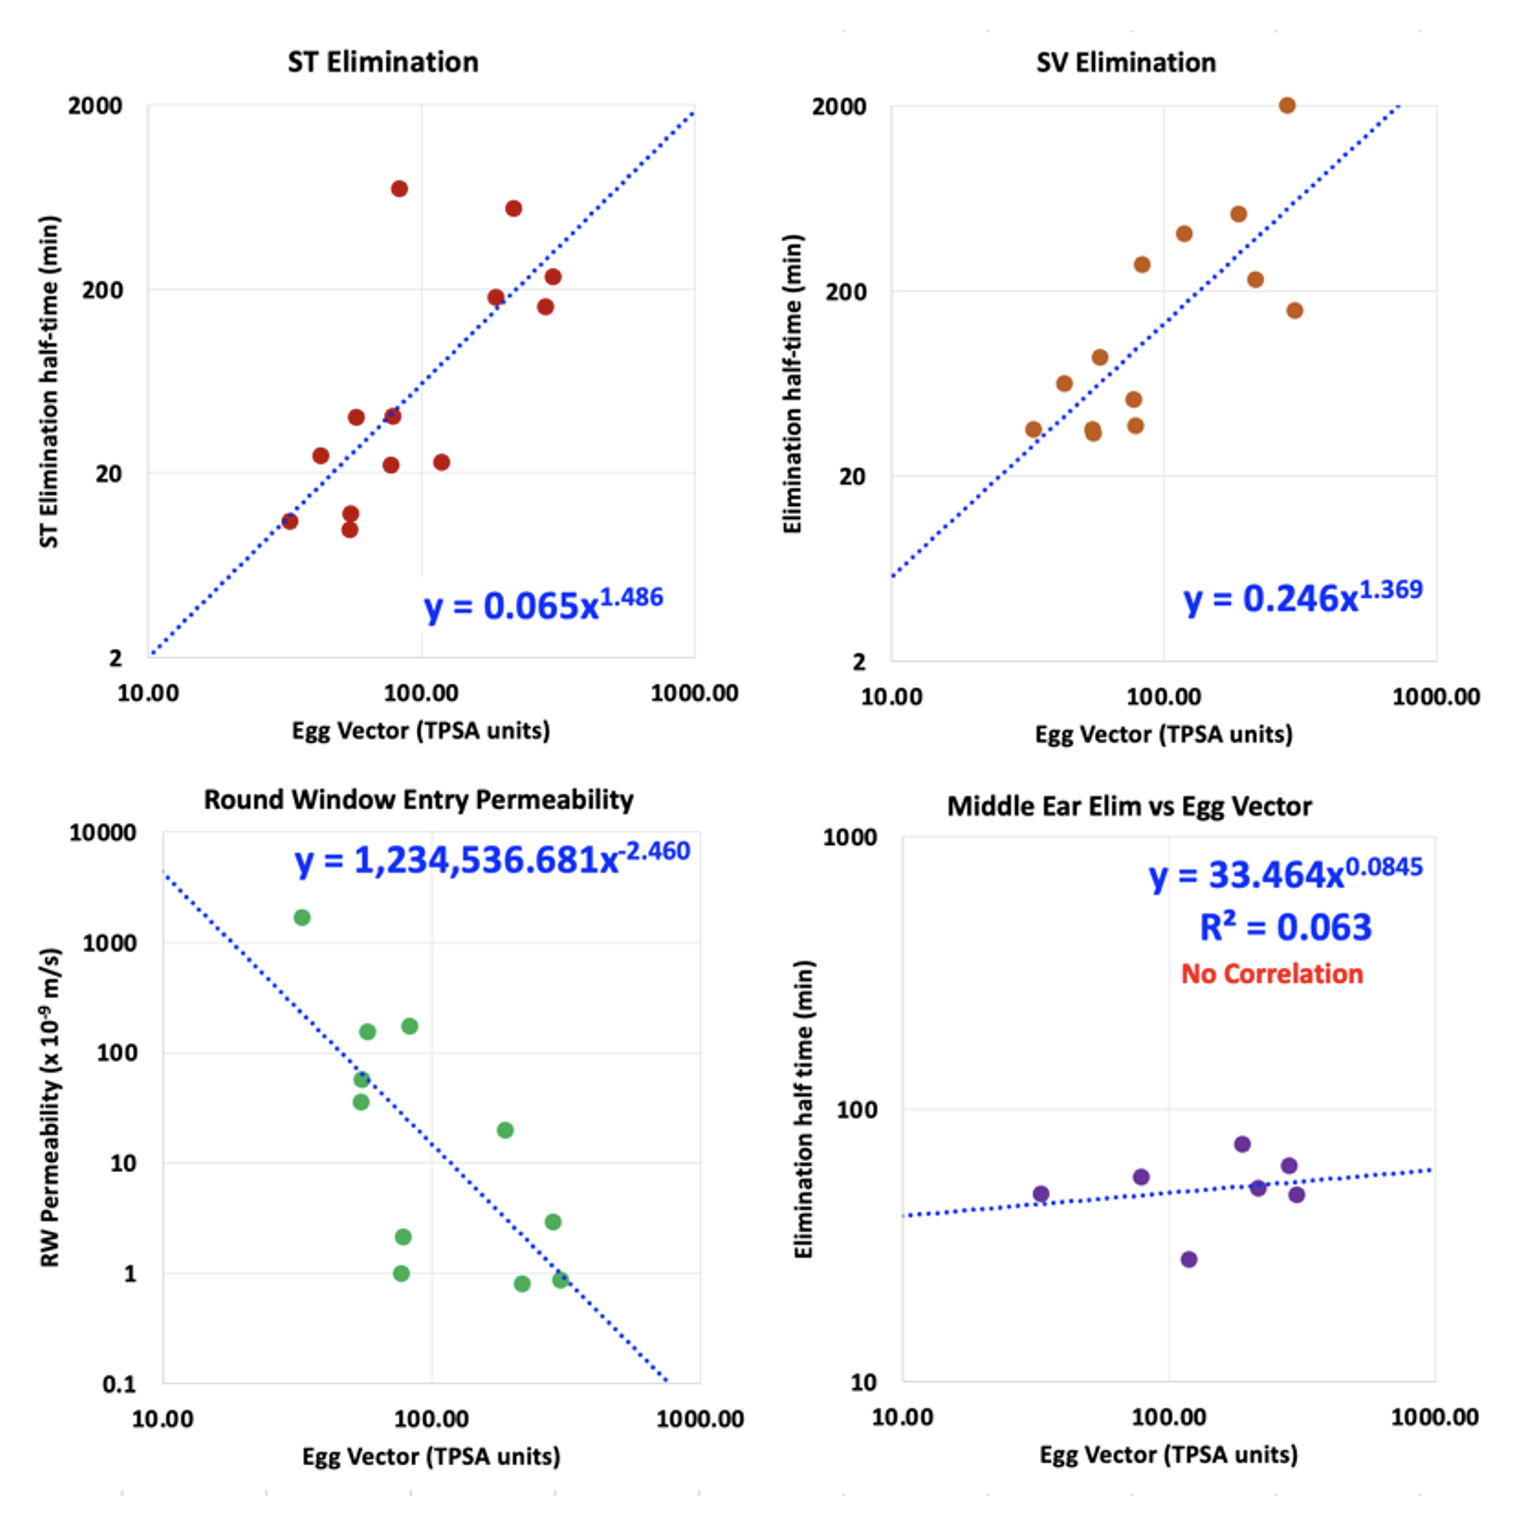
Figure 6: Left: Correlations between the rate of elimination from ST, rate of elimination from SV, RW membrane permeability and Middle Ear Elimination versus the distance the molecule lies from the center of the “egg yolk” on the egg plot. These plots are based on elimination and RW entry measurements for 13 molecules (some published; others proprietary). Elimination from the middle ear is relatively uniform across a wide range of molecule properties and is regarded as non-specific in nature (probably mediated by the lymphatic system).
Calculations by FluidSim for the specific delivery protocol used with the molecule allow an initial estimate of drug distribution to be made for the chosen species. Such calculations should be later supplemented with PK measurements for the molecule in an animal model.
4) Is my potential drug candidate suitable for systemic therapy of the human ear?
The “egg plot” analysis described above (the plot of WLOGP against TPSA) can be helpful when considering therapy of the ear by a drug given systemically. Molecules within the yellow ellipse (egg yolk) will typically pass through the blood-brain barrier (BBB) and enter the brain. The blood-labyrinth barrier (BLB) is comparable with the BBB, but may be somewhat less “tight”, allowing a greater range of molecules to enter as shown by the green ellipse in Figure 7.
It was shown in mice given fluorescein systemically that initial samples collected from the posterior semi-circular (predominantly perilymph) had higher fluorescein concentrations than later samples (predominantly CSF). This may indicate the BLB is more permeable, or may be explained by other mechanisms (perilymph volume smaller relative to blood flow, lower volume turnover of perilymph relative to CSF, etc). Whatever the mechanism, drug concentrations in perilymph may be higher than those in CSF, allowing “less permeable” molecules to reach therapeutic concentration.
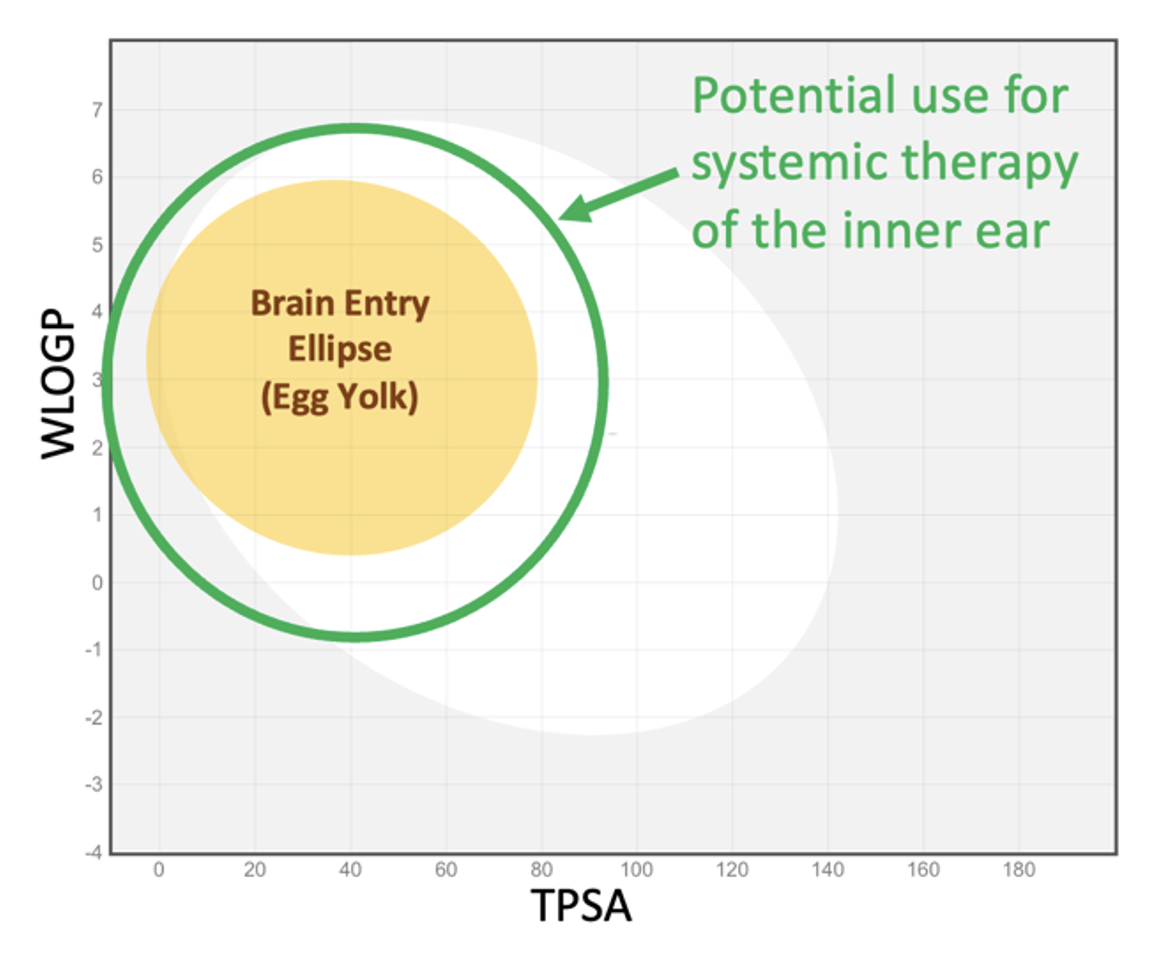
Figure 7: The green ellipse represents the approximate range of molecular properties making the molecule useful for systemic therapy of the inner ear. The ellipse is arbitrarily larger than the brain entry ellipse and is not statistically based on measured data (since virtually no appropriate data are available).
FluidSim can readily calculate entry into perilymph from the blood and can follow a changing blood time course. There is very little data available from which suitable parameters can be derived. The Salt lab fitted FluidSim simulations to measurements of perilymph concentration resulting from systemic fluorescein or systemic FITC-labeled dextran (4000 FW). The entry half-times were 5180 min, and 14,000 min respectively, which are far slower than the corresponding elimination times for these molecules, demonstrating the asymmetry of the BLB.
While the egg-plot provides a rough guide to which molecules will be suitable for systemic therapy of the ear, FluidSim cannot predict entry parameters as there is insufficient data to base a prediction on. Nevertheless, with a limited amount of PK data where blood and perilymph concentrations were measured suitable parameters can be extracted by FluidSim and used to simulate the entire perilymph time course resulting from the therapy.
5) We want to inject drug solution into the posterior semi-circular canal of the mouse. How much volume must be injected to fill the entire perilymph space with drug solution? How much difference does it make if the injection pipette isn’t properly sealed and we have a little fluid leakage at the injection site?
FluidSim excels at comparing injection conditions, such as different injection sites, different outlet locations, different injection rates and different volumes injected for different animal species.
The example in Figure 8 shows FluidSim calculations for posterior SCC injections at 0.1 uL/min in a mouse. The top left panel shows the distribution with distance through the mouse ear at different time points during the injection. At 2 min, the PSCC and vestibule are filled but scala tympani (distances up to ~4mm) only increases after 5 – 10 min. Loading the ear is substantially accomplished by a 10min injection, unless the concentration at the base of ST is critical. Drug is retained in the ear well after the injection stops.
Panels C and D of the Figure show the result when there is a slight leakage at the injection site, due to inadequate sealing. With a small leak, drug never reaches the cochlear apex with a 10 min injection and does not reach the basal half of ST even with the full 30 min injection. In addition, drug is rapidly washed out of perilymph as soon as the injection ceases (panel D).
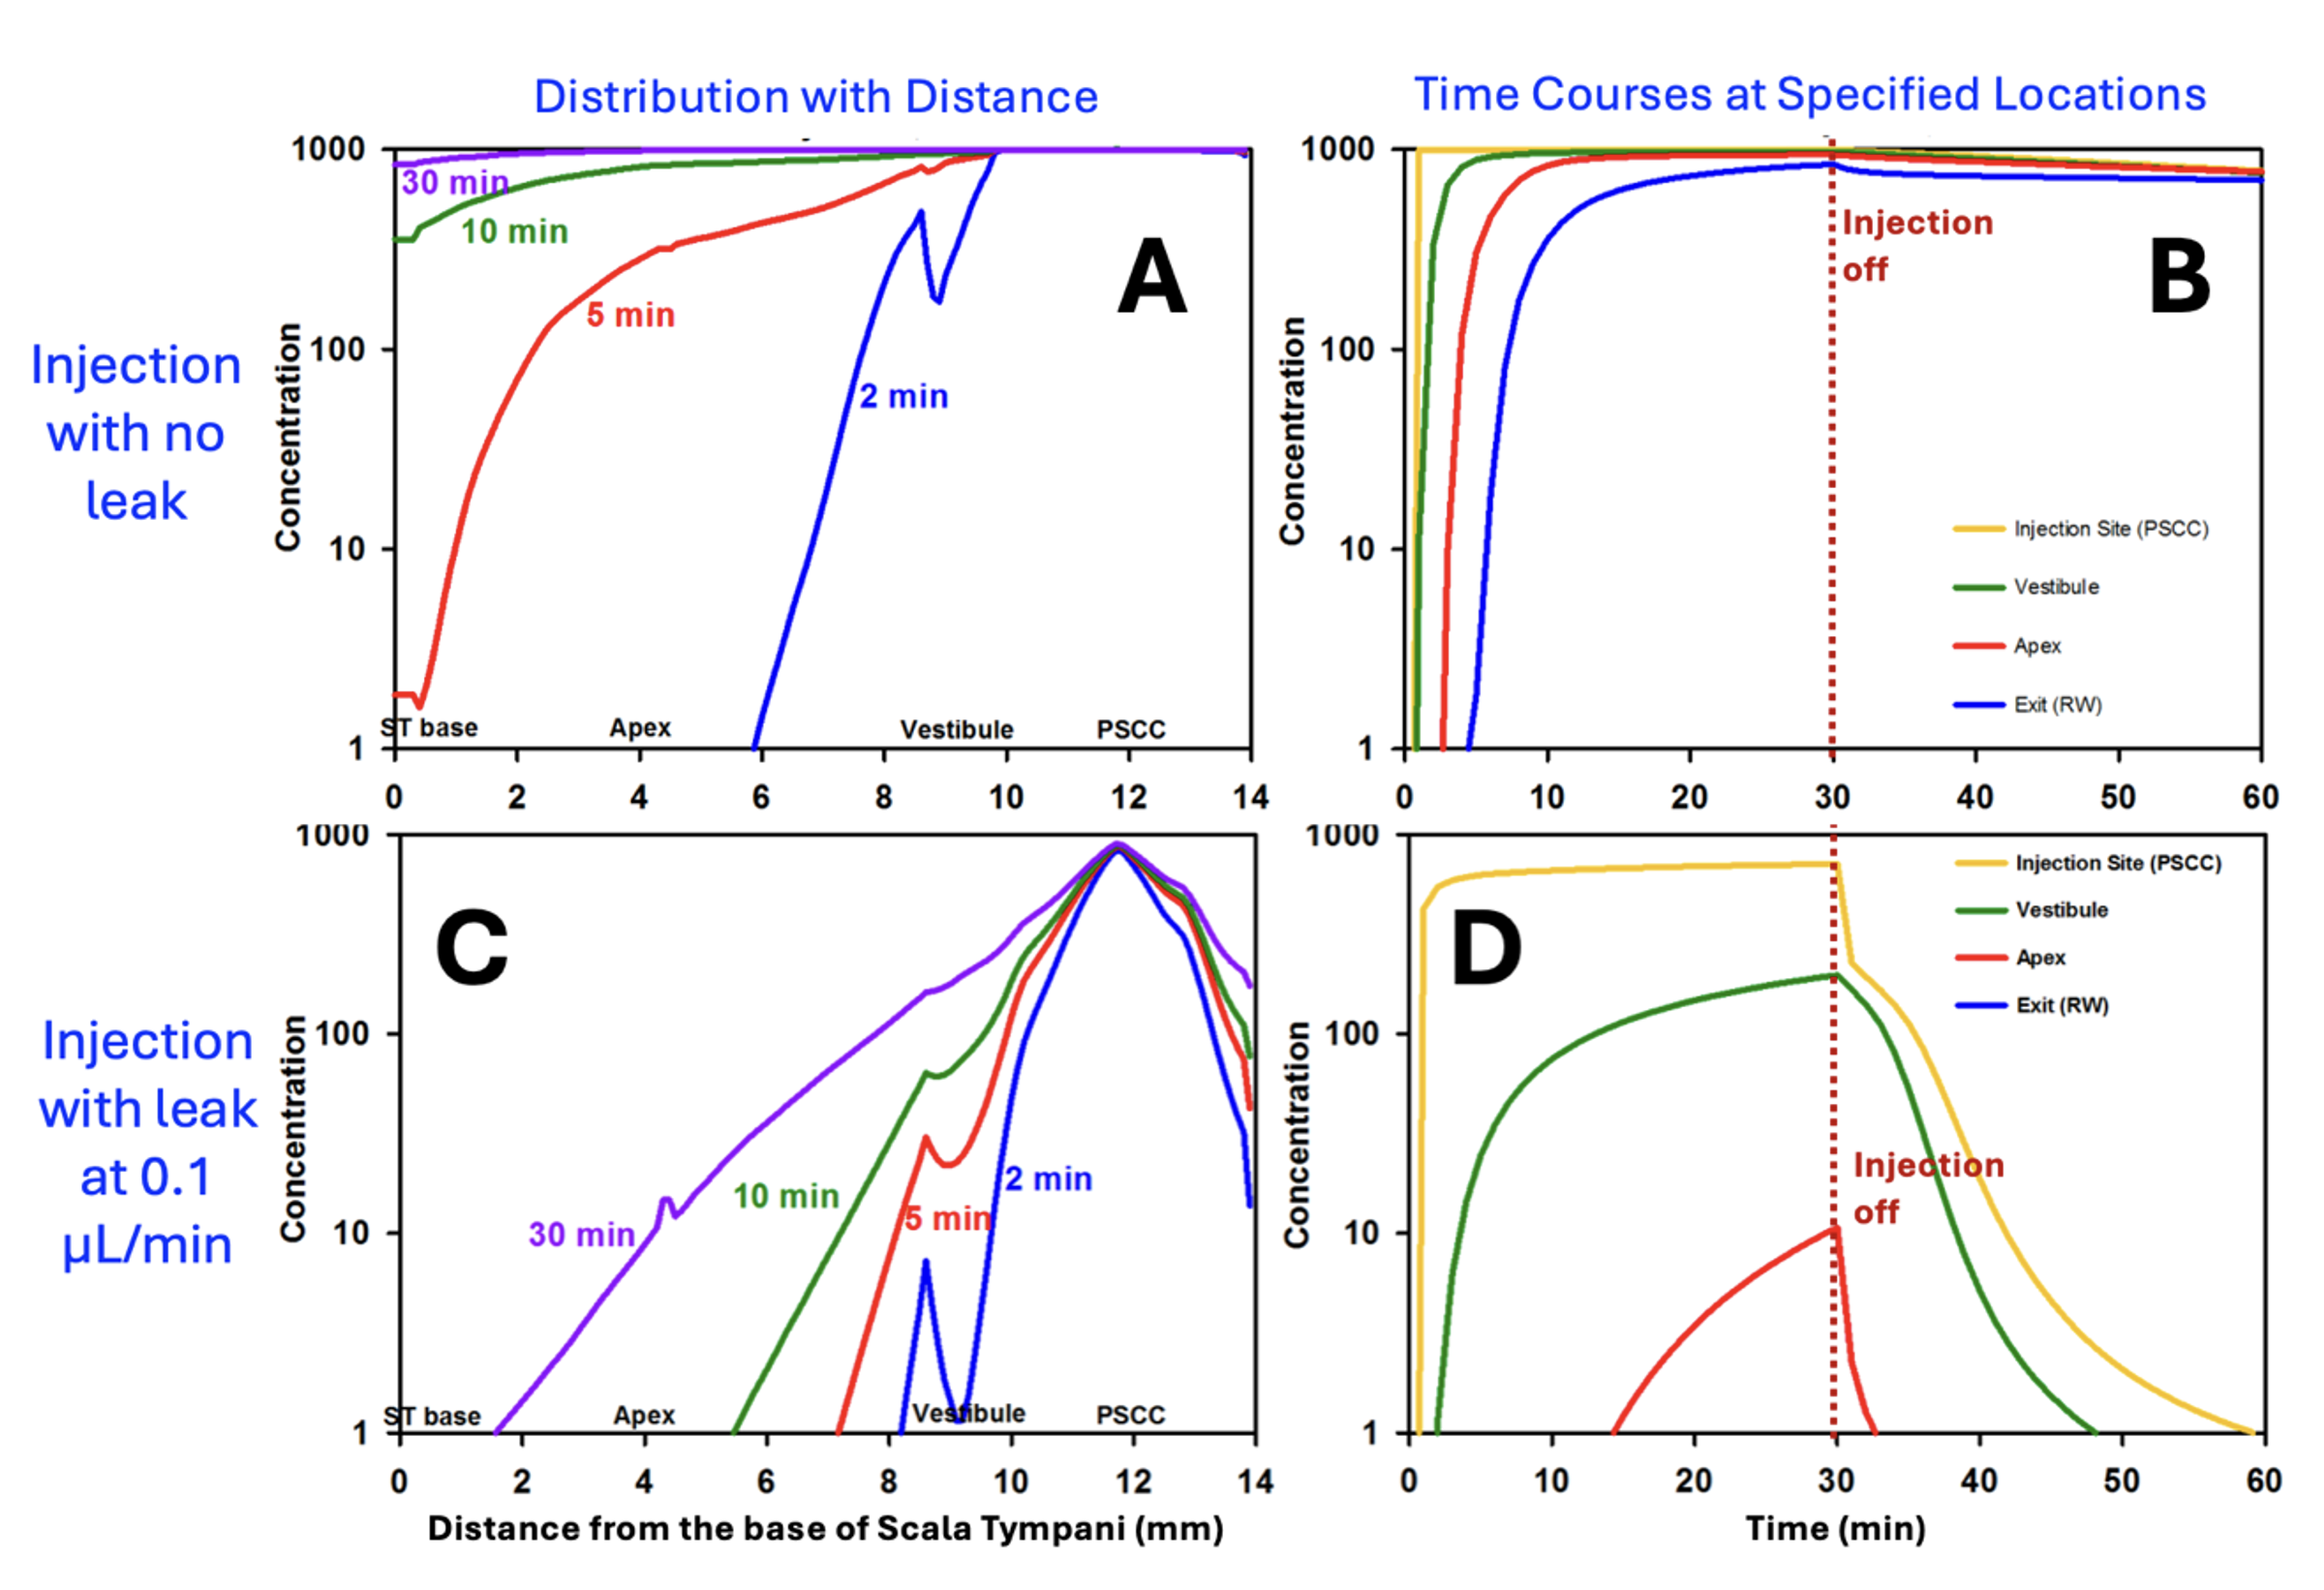
Figure 8: Calculated drug distribution (A) and time courses (B) for a 30 min, 0.1 uL/min injection from a pipette sealed into the posterior SCC of the mouse. Perilymph is well-loaded with drug in about 10 min and drug is retained well in the ear after the injection is turned off. C and D: Similar calculations for the situation when the pipette is incompletely sealed and is allowing a small fluid leak of just 0.1 uL/min. (Without sealing, leakage can be >10x this rate in the mouse). Perilymph concentrations in the cochlea are substantially lower, especially in scala tympani (i.e. distances up to ~4 mm) and drug in the vestibule is rapidly washed away when injection is turned off. (adapted from Ohlemiller et al., 2021)
FluidSim simulations therefore provide a rationale for how much drug volume needs to be injected to load specific regions of the inner ear.
Mouse perilymph can be loaded more rapidly by injecting at a higher rate.
This figure shows the distribution of drug within the mouse ear for injection at 0.5 uL/min. At this rate the ear becomes well loaded within 3-4 minutes.
Drug distribution depends on factors such as the rate of drug elimination from perilymph to blood, how well the pipette is sealed, and the injection rate. It also depends on the PK properties of the drug being used.
Ideally the FluidSim calculation should be set up to evaluate the specific conditions for the drug formulation being applied.
6) The drug we are injecting into the SCC of the mouse is potentially toxic to the brain. How much of the injected drug will be pushed into CSF through the cochlear aqueduct during the injection?
As scala tympani concentration rises during the injection, an increasing amount of drug will flow across the cochlear aqueduct into CSF, because the aqueduct is providing the outlet for volume flow. This figure shows the total drug amounts in the cochlea and in CSF as calculated by FluidSim.
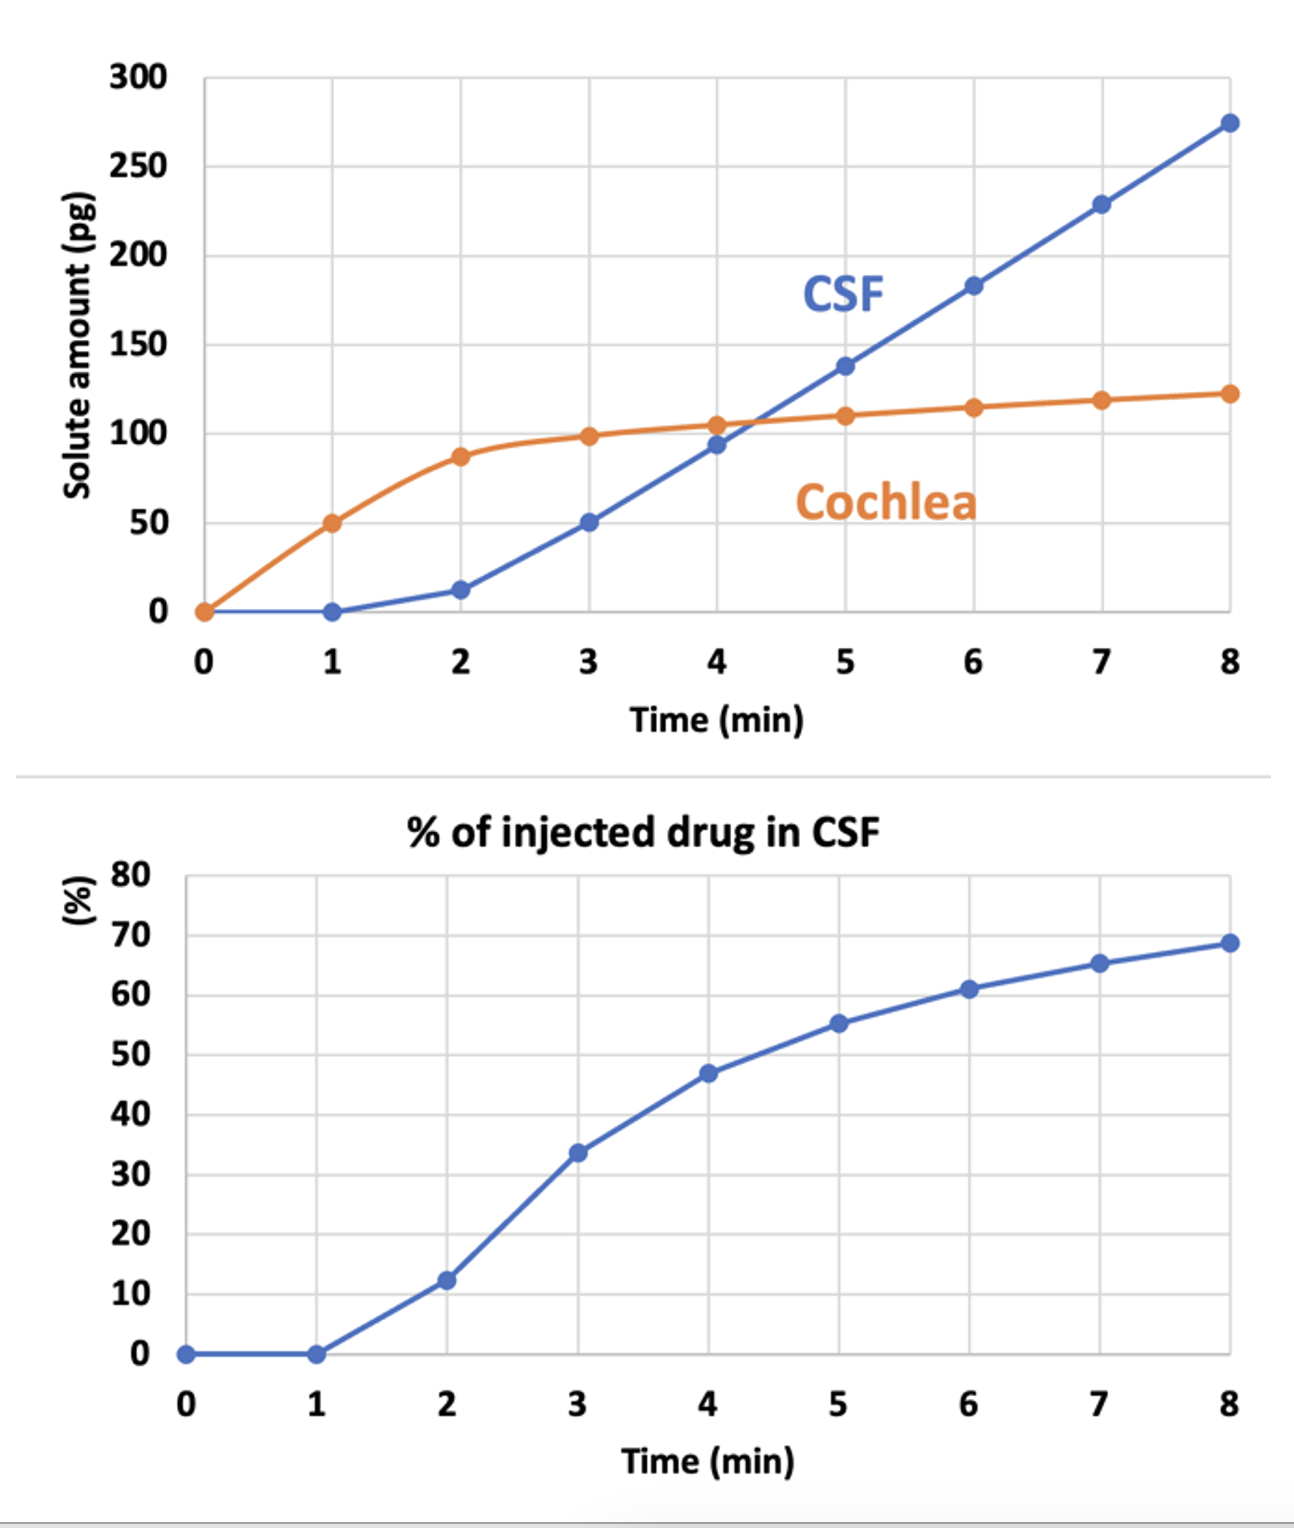
Amounts are calculated for an 8 min injection at 0.5 uL/min.
As soon as the cochlea is loaded with drug (orange curve, 2-3 mins), the amount being driven into CSF starts rising. The longer the injection, more drug will be driven into CSF.
This show why it is important to limit the injection rate and volume, if delivery into CSF can cause potential problems.
FluidSim can calculate the amounts involved for you specific delivery conditions and taking into account the PK properties of the drug you are using.
Submit a question related to your own study interests. If an analysis with FluidSim would be helpful in your situation, we will add the example here. Email your question / example to This email address is being protected from spambots. You need JavaScript enabled to view it..
Alec N Salt, PhD
March 27, 2024
Miscellaneous Science-Related Notes
1) Scientific Consensus
The media use the term "scientific consensus" to justify a certain point of view and to add support that it is "correct". The problem is that history has shown that the consensus view is often incorrect.
To quote Aaron Kheriaty, a fellow at the Ethics and Public Policy Center:
"Science is an ongoing search for truth & such truth has little to do with consensus. Every major scientific advance involves challenges to a consensus. Those who defend scientific consensus rather than specific experimental findings are not defending science but partisanship."
Most of the discoveries that I made in my career studying the inner ear went against the prevailing scientific consensus. Some were initially dismissed, but over time all have now become generally accepted. If you look back at history, many major breakthroughs also went against the consensus of the time. (Galileo anyone? Also see our history page: the ear was initially thought to be concerned only with hearing and not with balance). The consensus view (otherwise known as the current dogma) is often incorrect. Today, discussion of consensus is a method used to shut down those with opposing views. It is mostly used by narrow-minded people who don't understand science and who have difficulty reconciling multiple viewpoints. The concept that "all scientists agree" only occurs when the scientists who disagree are censored, are prevented from publishing their work by reviewers holding the majority view, or who choose to stay silent (perhaps to keep their grant funding). This is destroying science.
The reluctance to consider results that disagree with the current dogma led Max Planck to state
"A scientific truth does not triumph by convincing its opponents and making them see the light, but rather because its opponents eventually die and a new generation grows up that is familiar with it."
One can only hope that those in the censorship-industrial-complex pushing false, supposedly consensus views hurry up and get on with their part.
Dissenting views should be a normal part of any discourse
Artificial Intelligence (AI) will only make the situation worse. AI is generally based on the programmer's selection of "socially-acceptable" knowledge.
As our society increasingly silences and ignores dissenting perspectives, "unexpected" outcomes (i.e. outcomes contrary to the consensus view) will occur more frequently. Critical thinking and skepticism are essential for good science.
- You are here:
-
Home

-
Simulations
-
FluidSim 5
- Uncategorised