FluidSim Capabilities
What is FluidSim for and what does it do?
In contrast to blood, which is continually flowing and mixing, the fluids in the inner ear do not flow and are unstirred. So, when drug is applied, it doesn’t spread uniformly throughout the fluids. Instead, the drug slowly distributes along the fluid-filled spaces, a process that can take days. The rate of spread is so slow that if the drug leaks appreciably to the blood will never reach distant parts of the ear.
Therefore, for any drug being applied to the ear with a given methodology, we need to know how that drug distributes with distance and time. Distribution depends strongly on the physical properties of the drug. One of the primary tenets of pharmacotherapy is that the drug must reach the target tissue at a therapeutic concentration. In many cases this doesn’t happen for local drug therapies of the ear. Commonly the drug doesn’t reach the apical parts of the ear which are necessary to hear speech frequencies. For drug therapies of the cochlea, we therefore need to determine whether drug is reaching the targeted regions.
Situations where FluidSim can contribute:
1) We are giving a drug systemically that is potentially ototoxic at concentrations above 1 ng/mL. How do we design safety and toxicology studies at minimum cost?
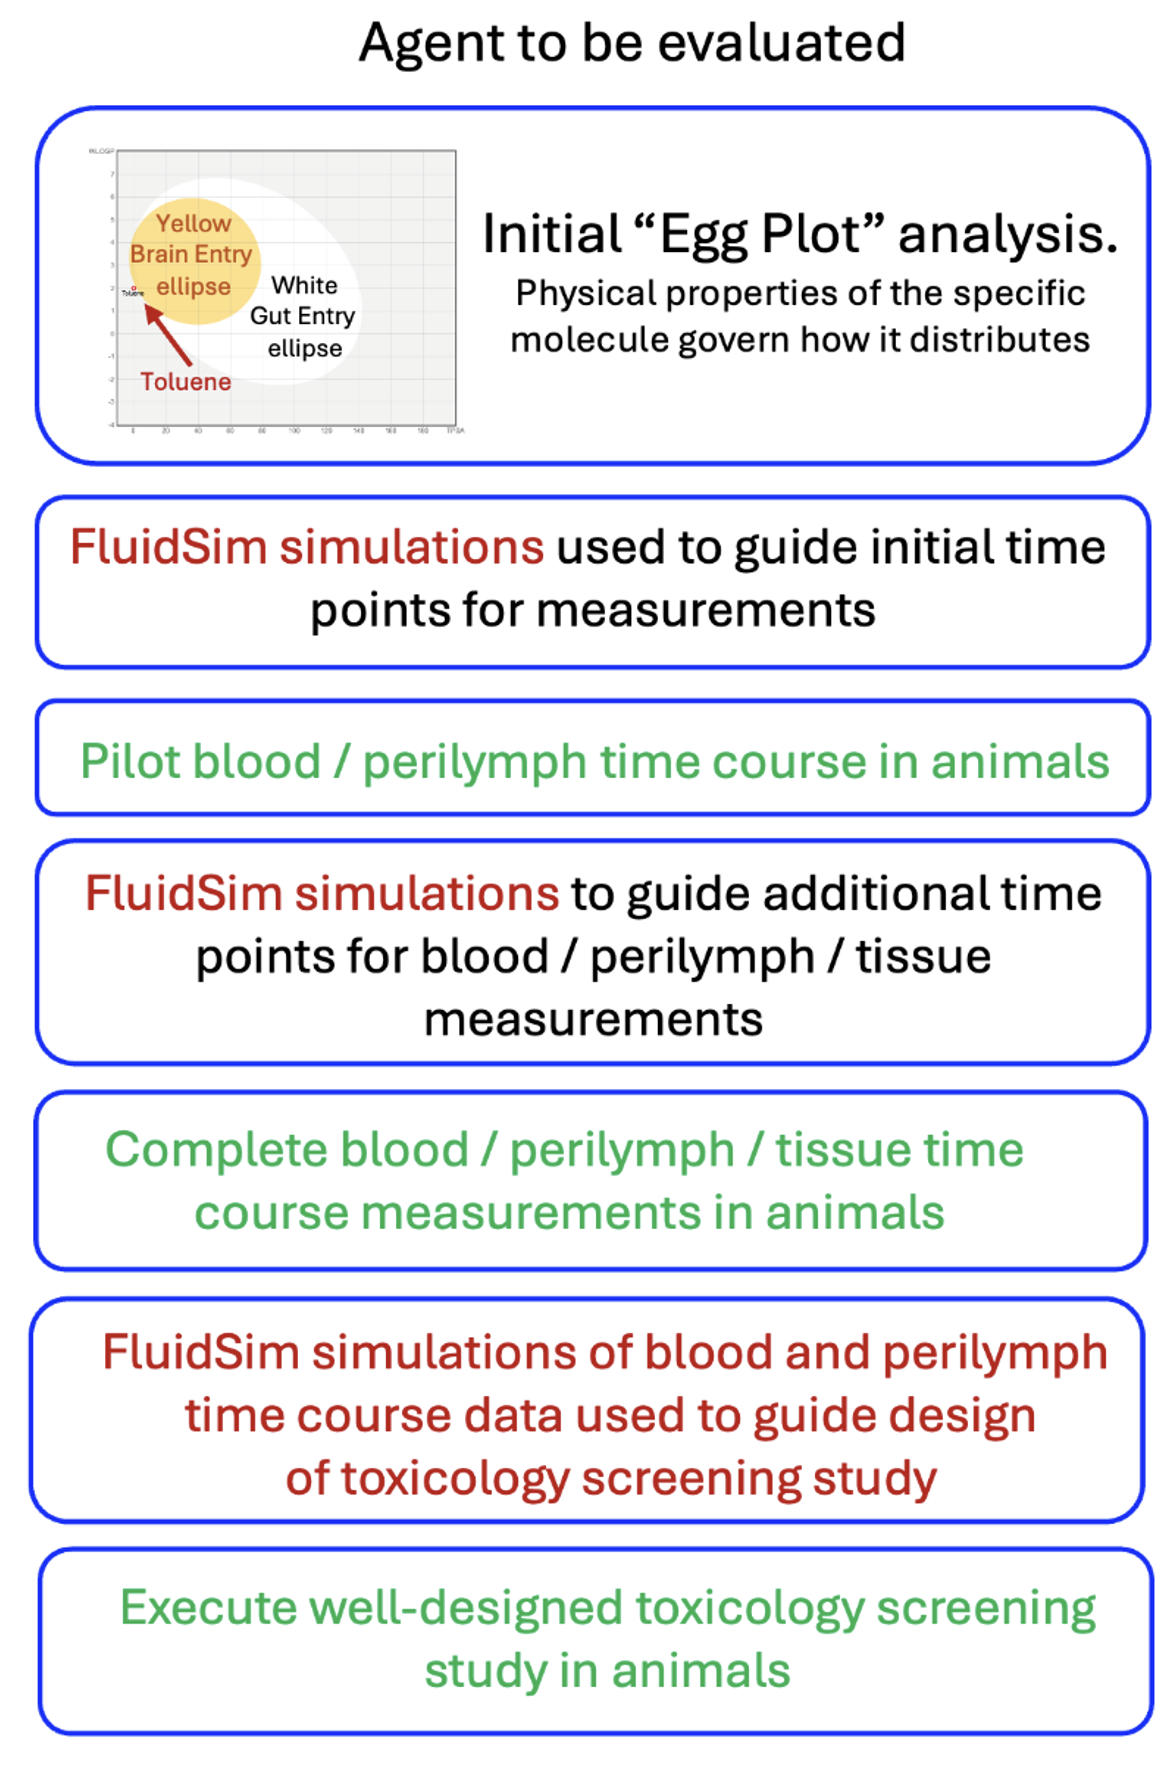
Before you start animal experiments, use FluidSim Simulations to help identify potential safety concerns and toxicity for the ear. Analysis can use the agent’s chemical characteristics to predict whether the therapeutic reaches the inner ear and in what concentration. Simulations provide a cost-effective way to design experiments with a minimum number of time points. They also help interpret blood and perilymph measurements, focusing on times and locations when drug concentrations exceed toxic levels, thereby saving animals and reducing costs.
As data are collected, simulations are refined until the drug time courses in blood and perilymph are established. These data help guide the design of the toxicology screening study. A well-designed, efficient study helps minimize the costs involved.
2) Will my small molecule therapy that works well in mice will work equally well in humans?
No, not necessarily. The mouse cochlea is short (~ 5 mm) and the human is much longer (~30 mm). This means that drugs that distribute well and treat all frequency regions of the mouse cochlea do not necessarily distribute completely along the human cochlea, thereby leaving some regions untreated. Figure 3 shows dexamethasone (Dex) distribution along scala tympani of the mouse, guinea pig and human calculated by FluidSim for a sustained, 24 hour application.
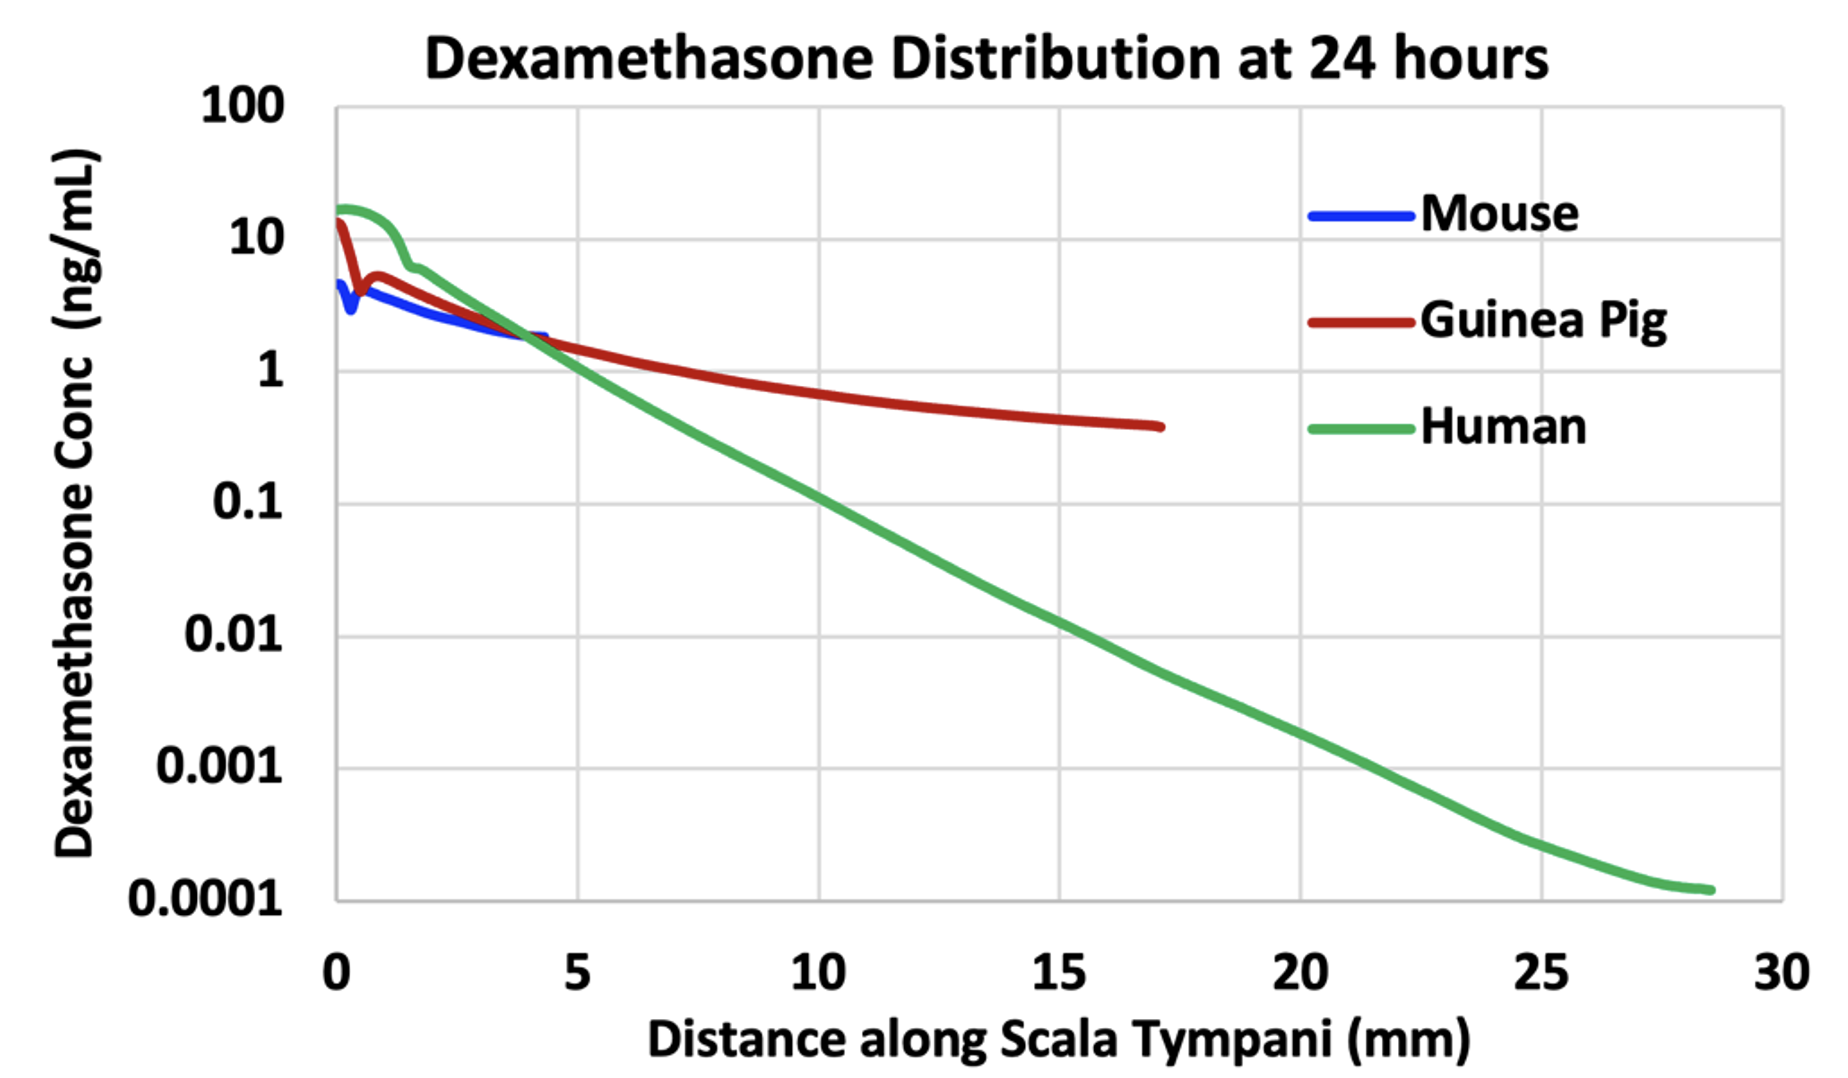
Figure 3: Dexamethasone gradients along ST calculated by FluidSim for a sustained application of dexamethasone (such as by dexamethasone suspension in gel) for 24 hours. The elimination half-times of dexamethasone were 40 min for ST and 87 min for SV. The “glitches” near the basal part of ST are the result of perilymph-CSF exchange through the cochlear aqueduct. In each case the “flattening” of the curve towards the apex is due to exchange with scala vestibuli across the helicotrema.
In the mouse, Dex is distributed along the entire length of the cochlea, with concentration at the apex just 2.5 x lower than at the base. In the guinea pig, the gradient is larger and is 35 x lower at the apex relative to the base. The gradient in the human is even larger, 136,000 x lower at the apex than the base, in part because a steady state has not been fully reached at 24 hours. Nevertheless, it is clear that apical regions of the human cochlea are treated with much lower levels of drug than basal regions.
It is also important to recognize that this is not an extreme example. How far drugs distribute along ST depends on how rapidly the substance is eliminated to blood. The half-time for Dex is estimated to be 40 min. The elimination rate of valproate, used in Frequency Therapeutics FX-322 formulation, was measured to be 19 min (McLean et al. 2021). The elimination rate of triamcinolone-acetonide was measured to be even faster, with a half time of 12 min (Salt et al. 2019). None of these drugs are suitable for treating the speech regions of the human cochlea. Figure 4 shows a figure from a corporate presentation by Frequency Therapeutics recognizing the limited spread of their therapeutic along the cochlea. The probably contributed to the failure of clinical trials with the therapy and the subsequent demise of the research program.
In conclusion, many drugs are not suitable for therapy of the speech regions of the human cochlea. Calculations with FluidSim can be instrumental in deciding whether a specific drug will distribute well, or not.
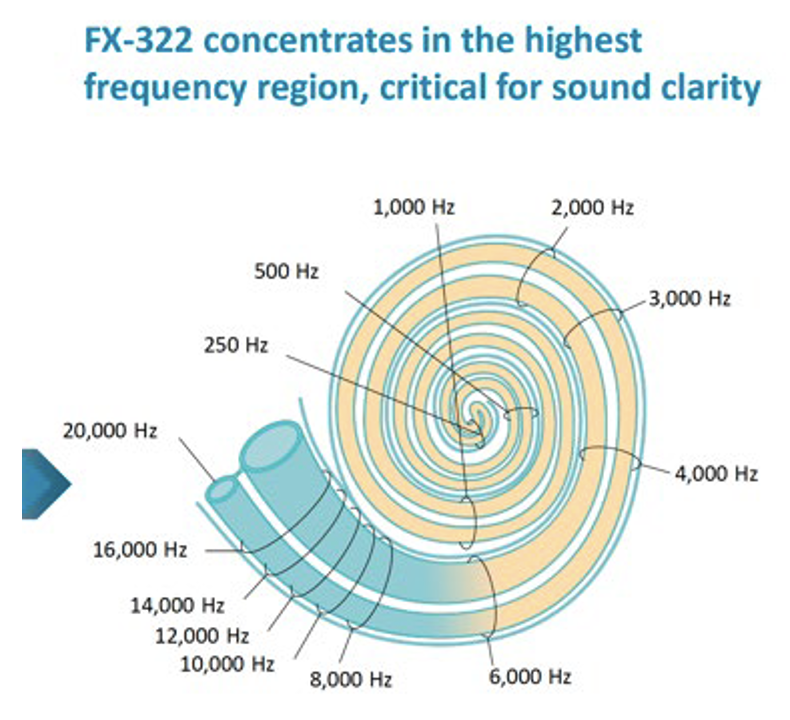
Figure 4: Calculated influence of Frequency Therapeutics FX-322 formulation along the human cochlea (figure taken from one of their public corporate presentations). It is notable that most of the speech frequency regions (all frequencies below 6 kHz) were NOT treated by their formulation, because of the limited distribution of drug along the cochlea.
3) Is my potential drug candidate suitable for local therapy of the human ear?
A lot of information is gained by calculating the physical properties of the drug, WLOGP (lipid partition coefficient) and TPSA (topological polar surface area). They can be calculated for any molecule on the SwissADME site (http://http://www.swissadme.ch). When WLOGP is plotted against TPSA it forms the so-called “egg plot”; Daina et al. 2017, providing a valuable indication of how the molecule will behave, as in Figure 5.
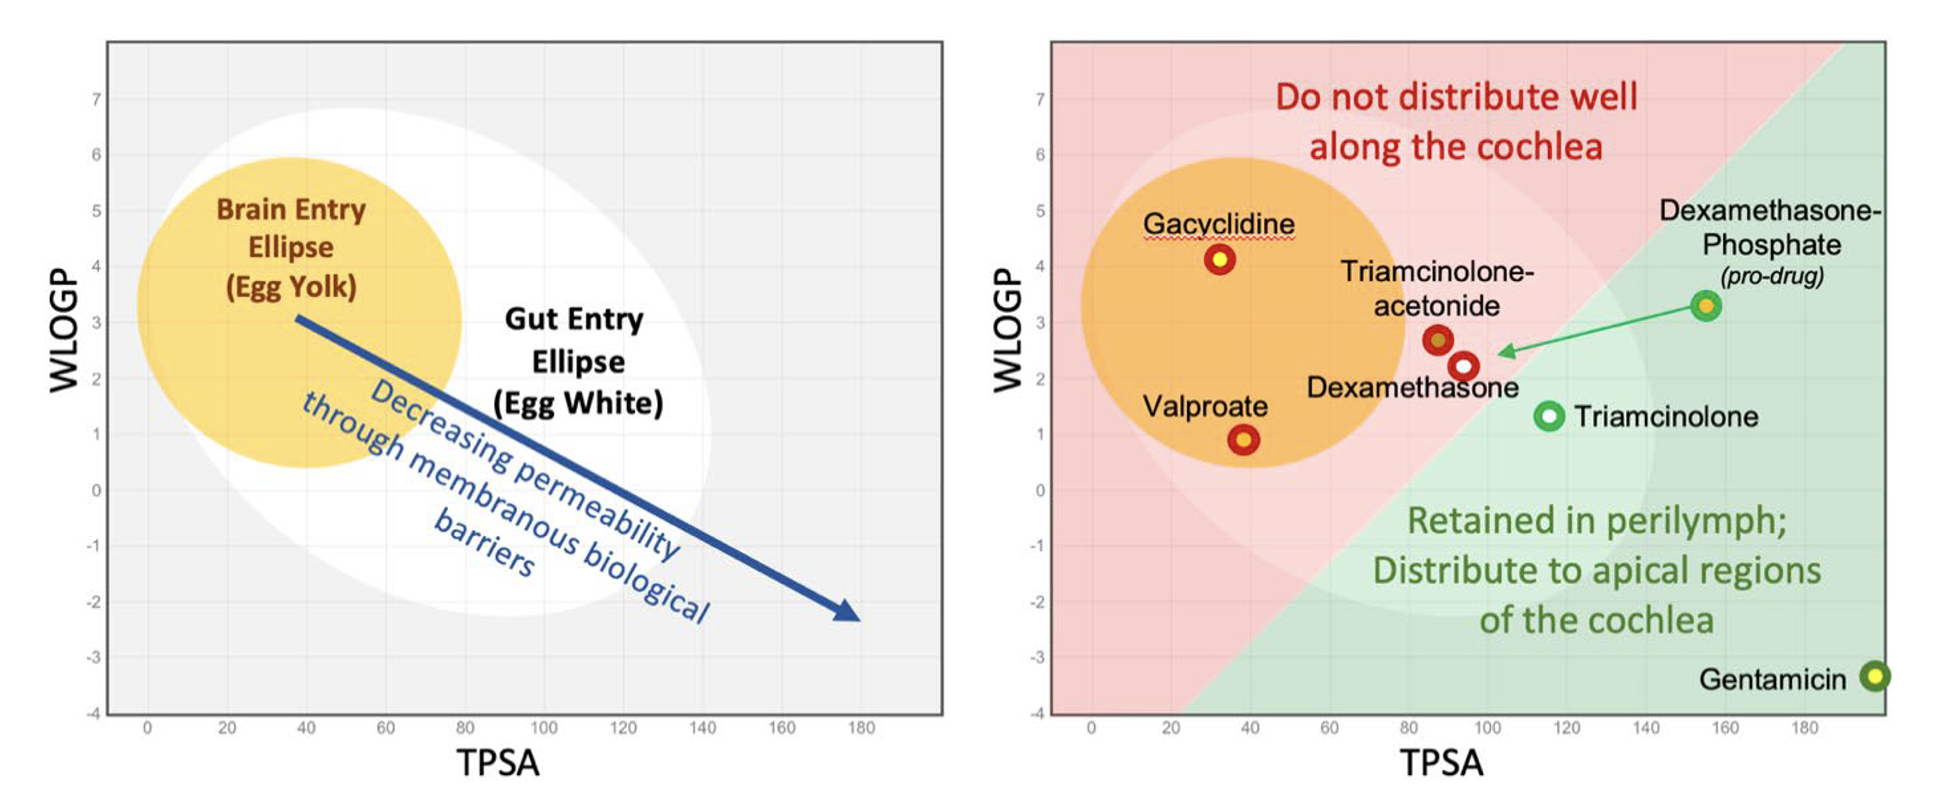
Figure 5: Left: As molecules become larger, more polar and less lipid-soluble (lower right of plot) they pass less easily through biological membranes. Molecules within the elliptical statistical boundaries pass through the blood brain barrier (yellow) or through the gut epithelium (white) respectively (Daina & Zoete, 2016; Daina et al. 2017). Right: Some example molecules relevant to the ear. Those in red are poorly suited to therapy of the cochlea, while those in green are retained in perilymph sufficiently to allow distribution towards apical cochlear regions. The red/green boundary is for illustrative purposes only and is not statistically based on data.
As shown in the right panel of Figure 5, molecules within or close to the “egg yolk” (in the red shaded area) commonly pass through biological membranes and are rapidly eliminated from perilymph. When applied intratympanically, they are generally NOT SUITABLE for treating speech regions of the cochlea.
A more detailed analysis of the molecule can be provided by analysis with FluidSim. If WLOGP and TPSA values for the molecule are entered on the “molecules” page FluidSim will then calculate the likely distribution of that molecule in the ear. FluidSim calculates rates of elimination from ST and SV are based on correlations established by measurement of elimination rates for 13 molecules in the Salt lab over the past 10 years (Figure 6). The fitted lines from these plots are used by FluidSim to predict the ST elimination rate, SV elimination rate and RWM permeability for each molecule, based on the “Egg Vector” derived from WLOGP and TPSA values. Middle ear elimination, by default is set to 49.6 min, which is the average of the 7 molecules for which middle ear elimination was measured (note that middle ear elimination can only be measured when drug is applied as a solution and cannot be measured when drug is applied as a suspension).
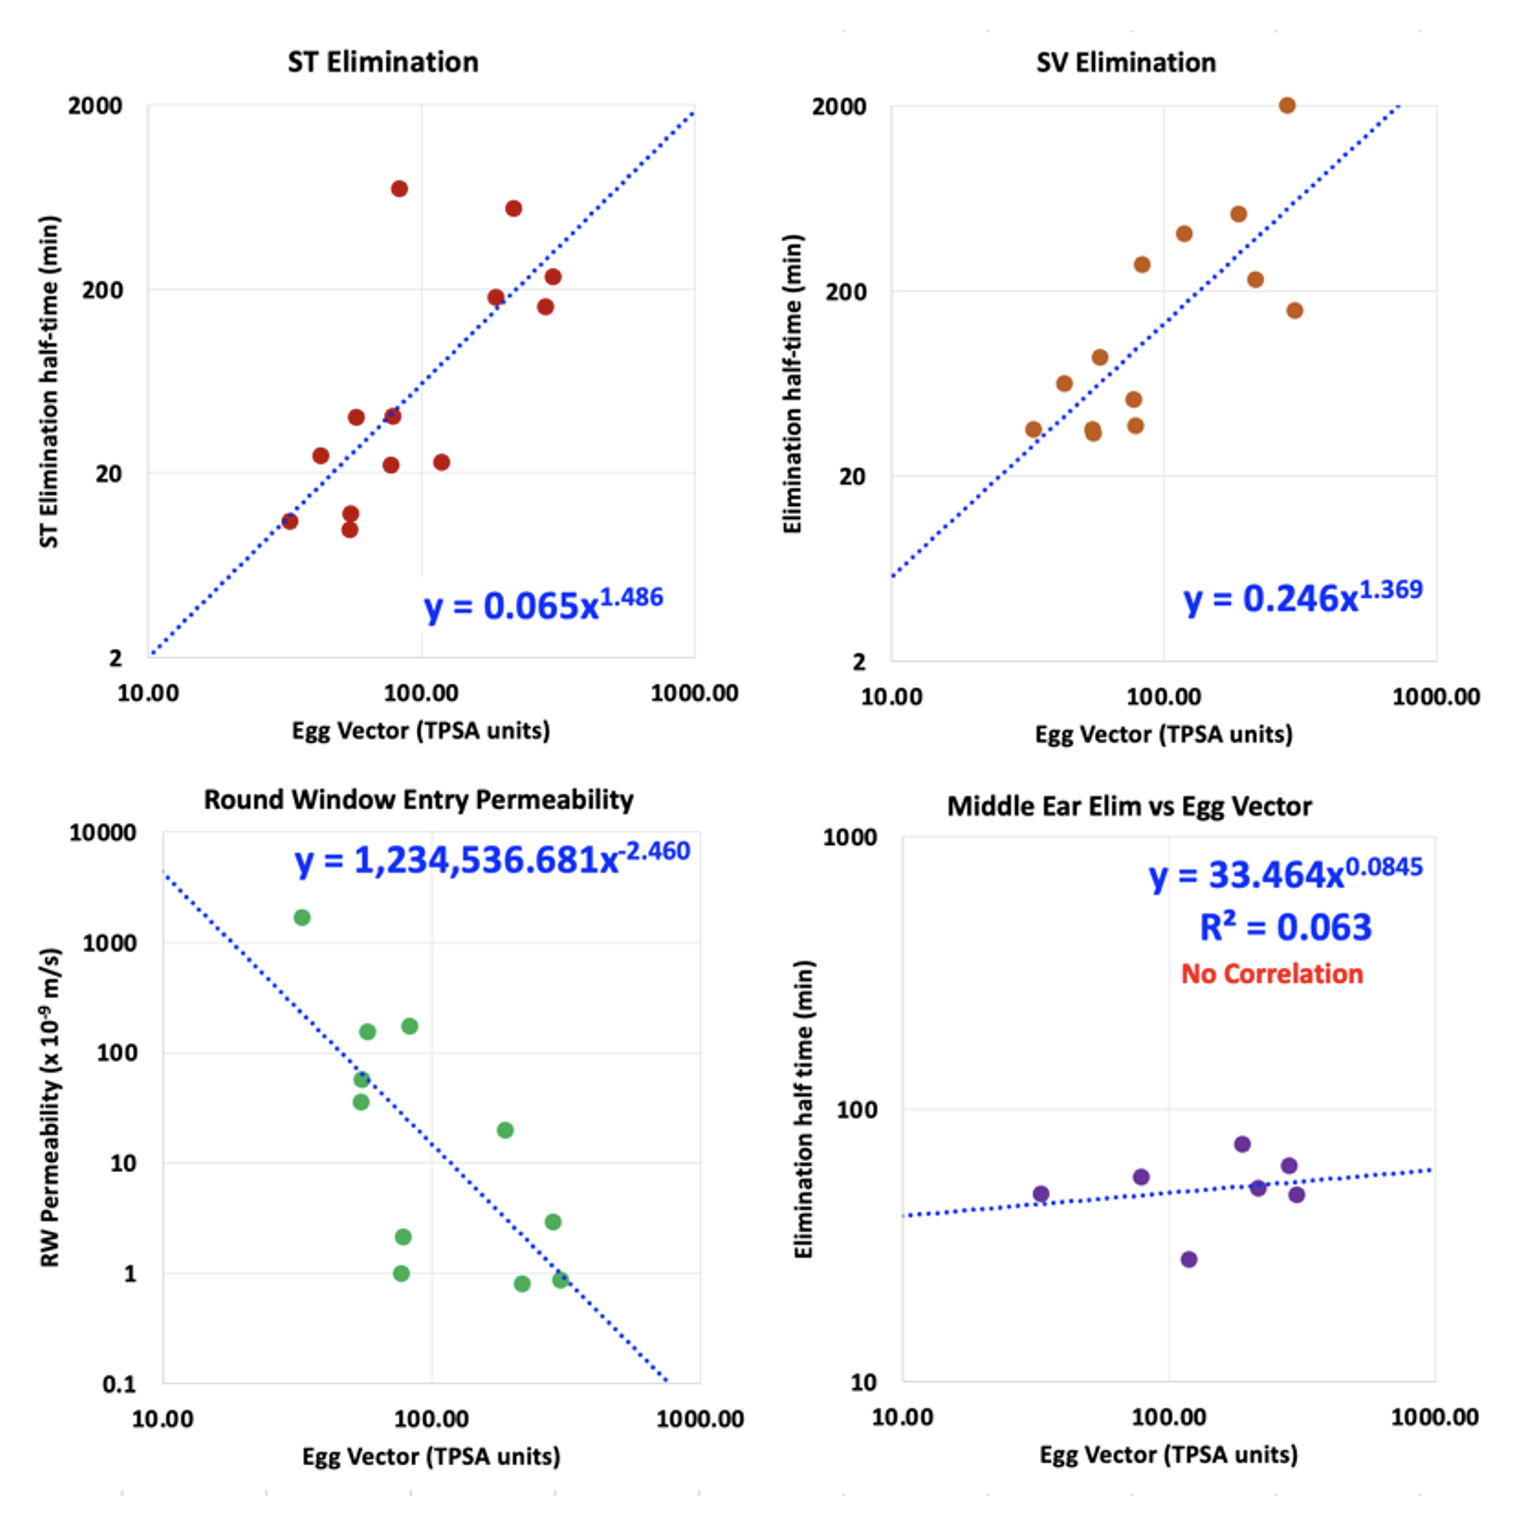
Figure 6: Left: Correlations between the rate of elimination from ST, rate of elimination from SV, RW membrane permeability and Middle Ear Elimination versus the distance the molecule lies from the center of the “egg yolk” on the egg plot. These plots are based on elimination and RW entry measurements for 13 molecules (some published; others proprietary). Elimination from the middle ear is relatively uniform across a wide range of molecule properties and is regarded as non-specific in nature (probably mediated by the lymphatic system).
Calculations by FluidSim for the specific delivery protocol used with the molecule allow an initial estimate of drug distribution to be made for the chosen species. Such calculations should be later supplemented with PK measurements for the molecule in an animal model.
4) Is my potential drug candidate suitable for systemic therapy of the human ear?
The “egg plot” analysis described above (the plot of WLOGP against TPSA) can be helpful when considering therapy of the ear by a drug given systemically. Molecules within the yellow ellipse (egg yolk) will typically pass through the blood-brain barrier (BBB) and enter the brain. The blood-labyrinth barrier (BLB) is comparable with the BBB, but may be somewhat less “tight”, allowing a greater range of molecules to enter as shown by the green ellipse in Figure 7.
It was shown in mice given fluorescein systemically that initial samples collected from the posterior semi-circular (predominantly perilymph) had higher fluorescein concentrations than later samples (predominantly CSF). This may indicate the BLB is more permeable, or may be explained by other mechanisms (perilymph volume smaller relative to blood flow, lower volume turnover of perilymph relative to CSF, etc). Whatever the mechanism, drug concentrations in perilymph may be higher than those in CSF, allowing “less permeable” molecules to reach therapeutic concentration.
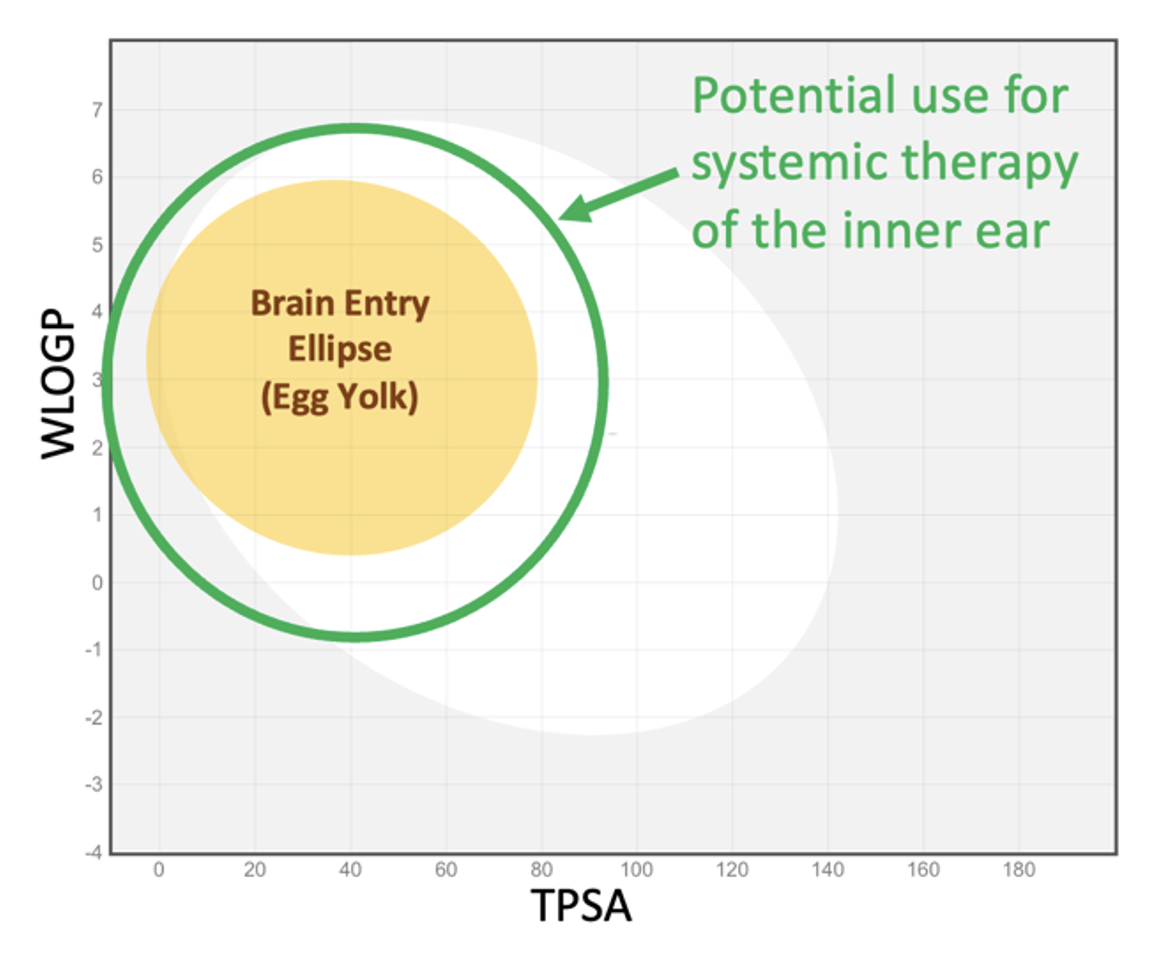
Figure 7: The green ellipse represents the approximate range of molecular properties making the molecule useful for systemic therapy of the inner ear. The ellipse is arbitrarily larger than the brain entry ellipse and is not statistically based on measured data (since virtually no appropriate data are available).
FluidSim can readily calculate entry into perilymph from the blood and can follow a changing blood time course. There is very little data available from which suitable parameters can be derived. The Salt lab fitted FluidSim simulations to measurements of perilymph concentration resulting from systemic fluorescein or systemic FITC-labeled dextran (4000 FW). The entry half-times were 5180 min, and 14,000 min respectively, which are far slower than the corresponding elimination times for these molecules, demonstrating the asymmetry of the BLB.
While the egg-plot provides a rough guide to which molecules will be suitable for systemic therapy of the ear, FluidSim cannot predict entry parameters as there is insufficient data to base a prediction on. Nevertheless, with a limited amount of PK data where blood and perilymph concentrations were measured suitable parameters can be extracted by FluidSim and used to simulate the entire perilymph time course resulting from the therapy.
5) We want to inject drug solution into the posterior semi-circular canal of the mouse. How much volume must be injected to fill the entire perilymph space with drug solution? How much difference does it make if the injection pipette isn’t properly sealed and we have a little fluid leakage at the injection site?
FluidSim excels at comparing injection conditions, such as different injection sites, different outlet locations, different injection rates and different volumes injected for different animal species.
The example in Figure 8 shows FluidSim calculations for posterior SCC injections at 0.1 uL/min in a mouse. The top left panel shows the distribution with distance through the mouse ear at different time points during the injection. At 2 min, the PSCC and vestibule are filled but scala tympani (distances up to ~4mm) only increases after 5 – 10 min. Loading the ear is substantially accomplished by a 10min injection, unless the concentration at the base of ST is critical. Drug is retained in the ear well after the injection stops.
Panels C and D of the Figure show the result when there is a slight leakage at the injection site, due to inadequate sealing. With a small leak, drug never reaches the cochlear apex with a 10 min injection and does not reach the basal half of ST even with the full 30 min injection. In addition, drug is rapidly washed out of perilymph as soon as the injection ceases (panel D).
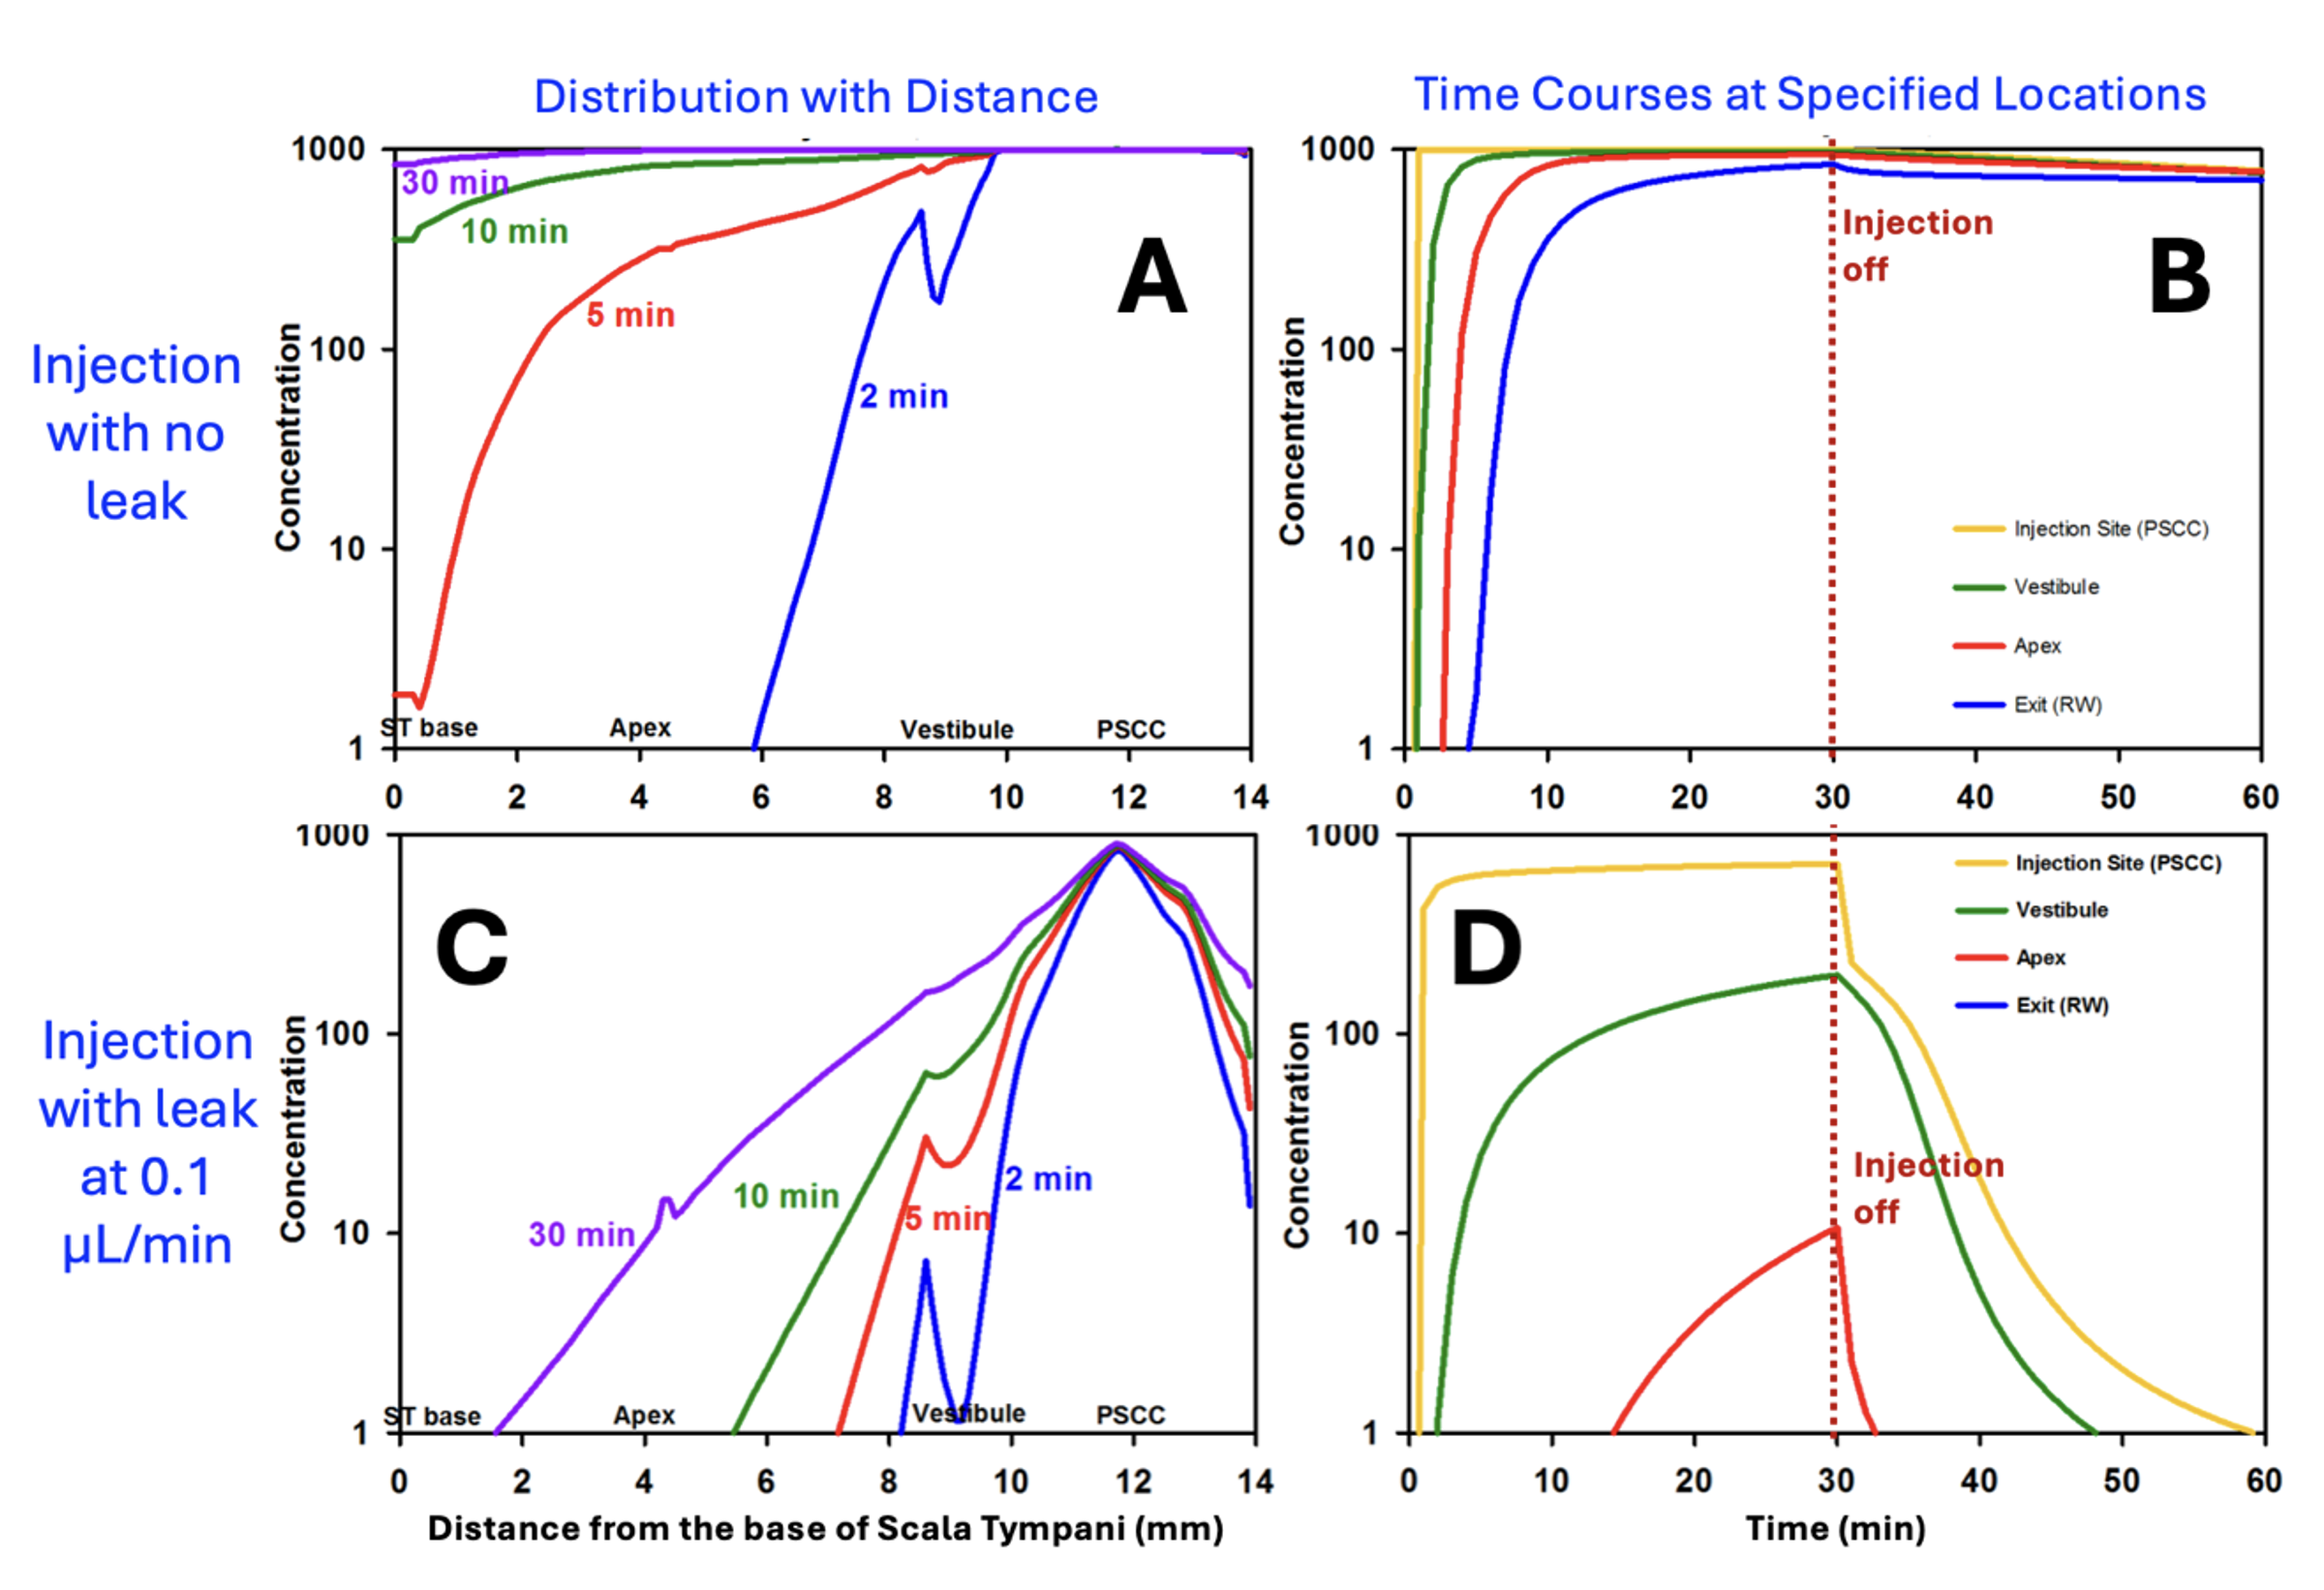
Figure 8: Calculated drug distribution (A) and time courses (B) for a 30 min, 0.1 uL/min injection from a pipette sealed into the posterior SCC of the mouse. Perilymph is well-loaded with drug in about 10 min and drug is retained well in the ear after the injection is turned off. C and D: Similar calculations for the situation when the pipette is incompletely sealed and is allowing a small fluid leak of just 0.1 uL/min. (Without sealing, leakage can be >10x this rate in the mouse). Perilymph concentrations in the cochlea are substantially lower, especially in scala tympani (i.e. distances up to ~4 mm) and drug in the vestibule is rapidly washed away when injection is turned off. (adapted from Ohlemiller et al., 2021)
FluidSim simulations therefore provide a rationale for how much drug volume needs to be injected to load specific regions of the inner ear.
Mouse perilymph can be loaded more rapidly by injecting at a higher rate.
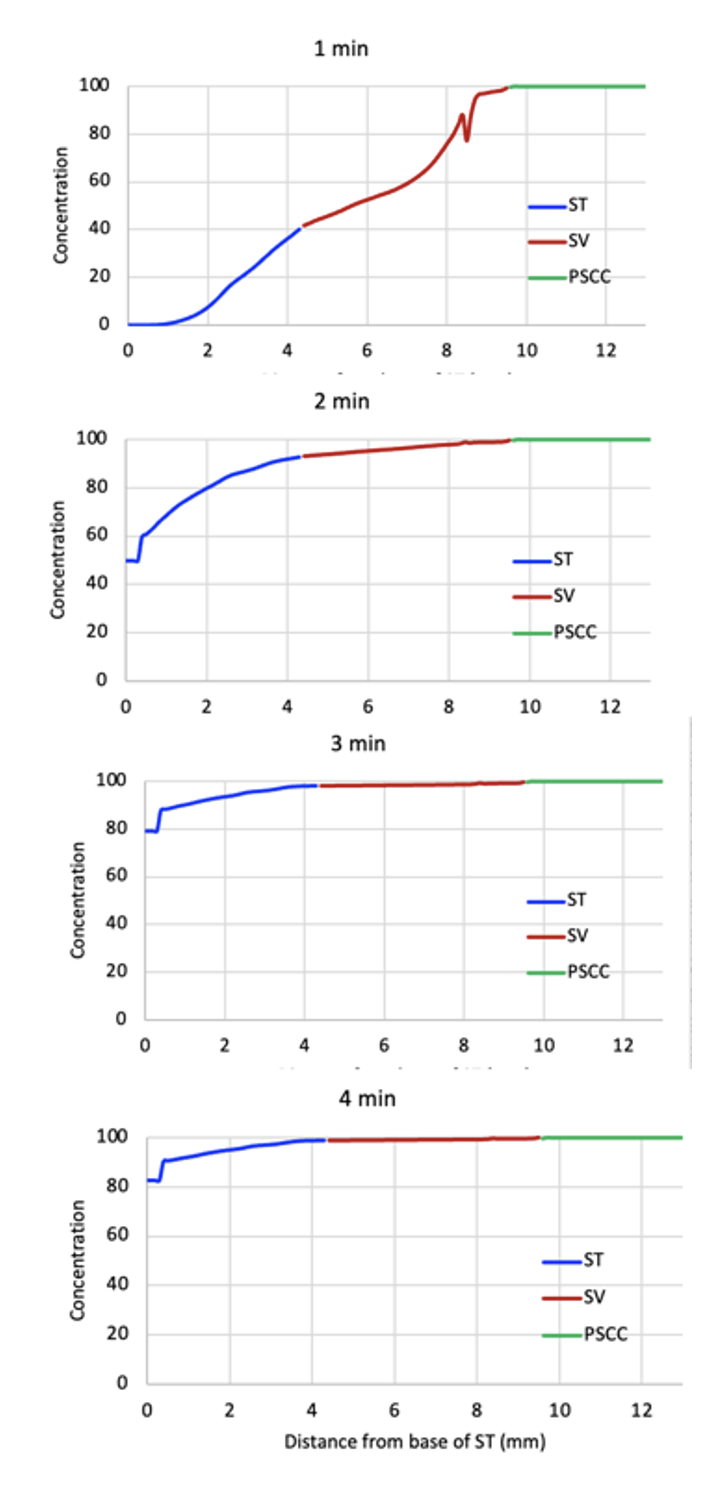
This figure shows the distribution of drug within the mouse ear for injection at 0.5 uL/min. At this rate the ear becomes well loaded within 3-4 minutes.
Drug distribution depends on factors such as the rate of drug elimination from perilymph to blood, how well the pipette is sealed, and the injection rate. It also depends on the PK properties of the drug being used.
Ideally the FluidSim calculation should be set up to evaluate the specific conditions for the drug formulation being applied.
6) The drug we are injecting into the SCC of the mouse is potentially toxic to the brain. How much of the injected drug will be pushed into CSF through the cochlear aqueduct during the injection?
As scala tympani concentration rises during the injection, an increasing amount of drug will flow across the cochlear aqueduct into CSF, because the aqueduct is providing the outlet for volume flow. This figure shows the total drug amounts in the cochlea and in CSF as calculated by FluidSim.
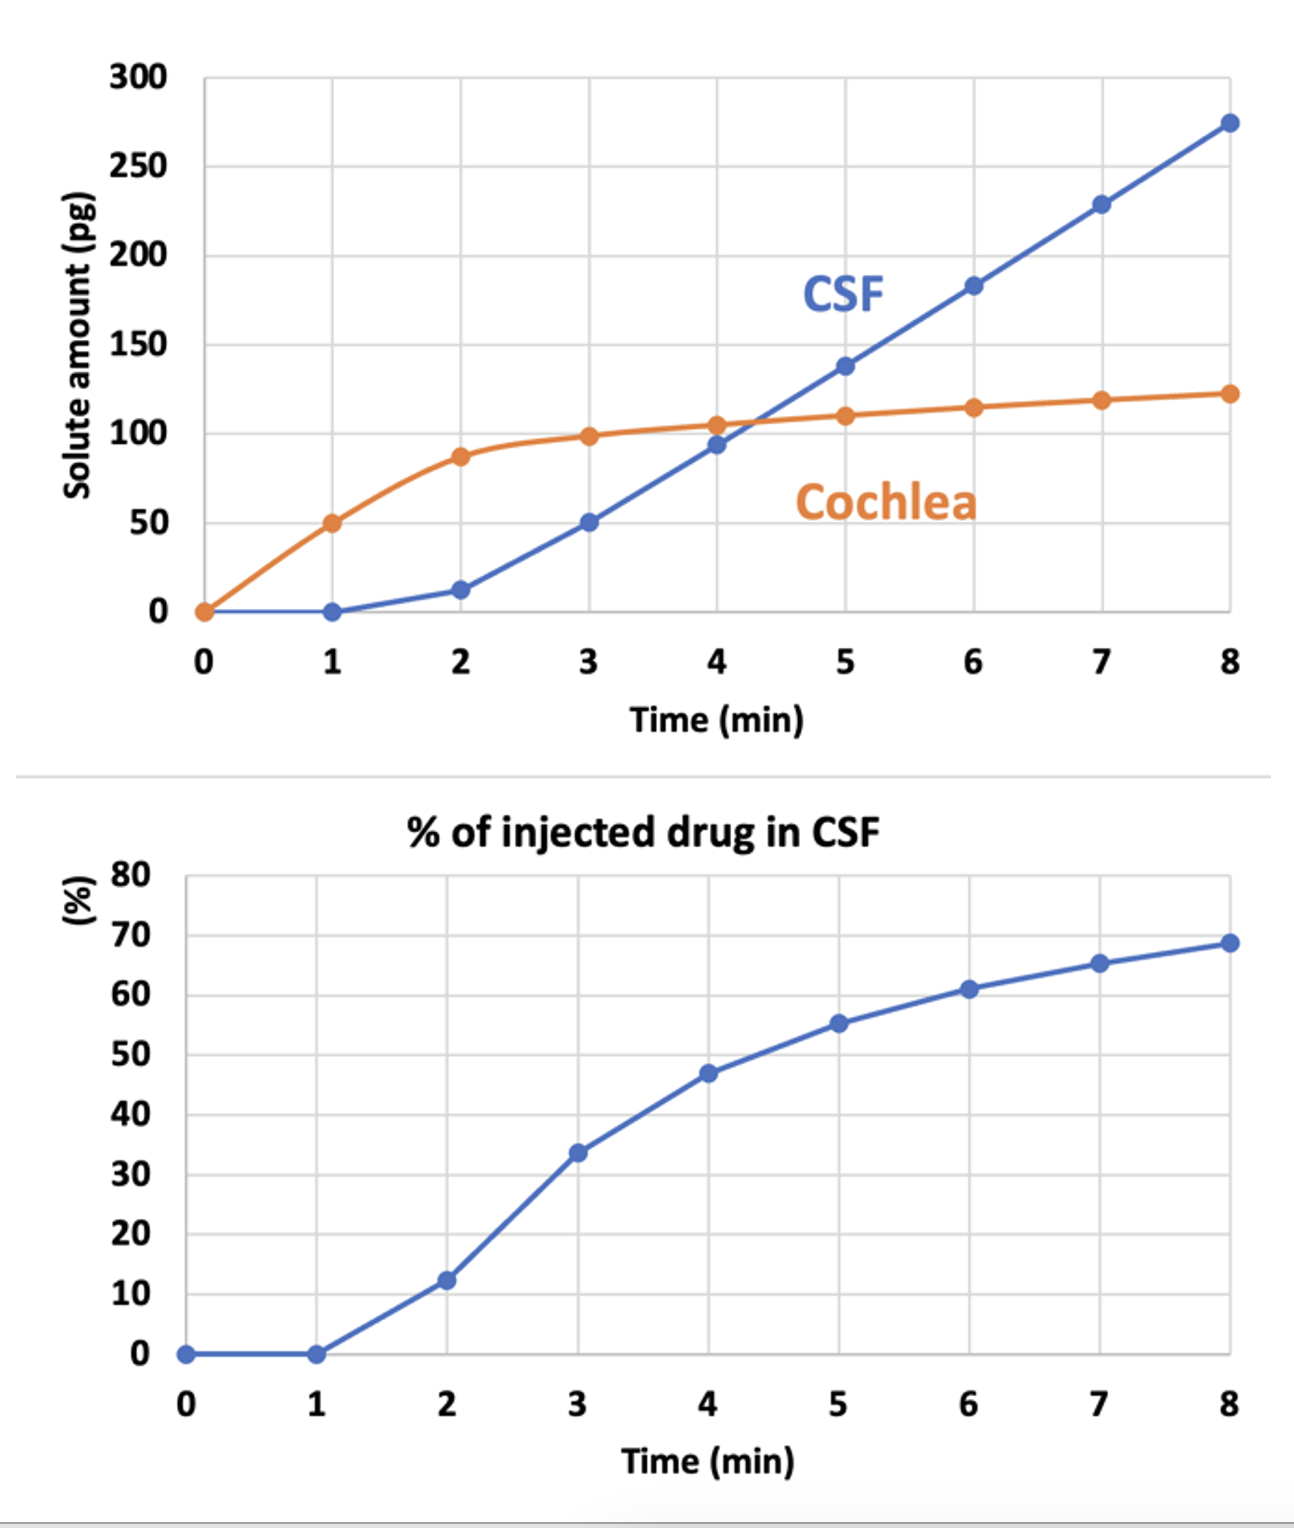
Amounts are calculated for an 8 min injection at 0.5 uL/min.
As soon as the cochlea is loaded with drug (orange curve, 2-3 mins), the amount being driven into CSF starts rising. The longer the injection, more drug will be driven into CSF.
This show why it is important to limit the injection rate and volume, if delivery into CSF can cause potential problems.
FluidSim can calculate the amounts involved for you specific delivery conditions and taking into account the PK properties of the drug you are using.
Submit a question related to your own study interests. If an analysis with FluidSim would be helpful in your situation, we will add the example here. Email your question / example to
Alec N Salt, PhD
March 27, 2024